 |
Asia-Pacific Forum on Science Learning and Teaching, Volume 19, Issue 2, Article 10 (Dec., 2018) |
Within a quasi-experimental research design, two grade 7 classes were purposefully selected from junior high schools in Lampung, Indonesia. The same topic (environmental pollution) was taught to both classes. The control group (n = 32 students) was exposed to the conventional instruction, whilst the experimental group (n = 32 students) was instructed with the worksheets. Then, the experimental and control groups’ scientific literacy levels were assessed and compared. Later, independent samples t-test was employed to determine the effects of the teaching interventions on their scientific literacy levels. The data were obtained through the ‘scientific literacy’ questionnaire. The indicators of scientific literacy were classified into 3 domains: content, process, and scientific context.
Table 1. The indicators of scientific literacy
Content Presenting facts, concepts, principles, and laws.
Presenting hypotheses
Theories, and models
Asking students to remember knowledge or information
Process
The essence of science and a way of scientific thinking
Context
The interaction amongst science, technology, and society
(Chiapetta & Koballa,2006).
To assess grade 7 students' conceptual understanding of the ‘environmental pollution’ topic, the researchers created 15 a questionnaire on the relationship(s), understanding, and application(s) of the ‘environmental pollution’ topic. These questions were suitable for Bloom's taxonomy (C3-C6) and the foregoing three domains of scientific literacy. The researchers pilot-tested the ‘environment pollution’ questionnaire with 32 students, who had previously taken the same topic. Two groups firstly took a pre-test before the teaching intervention. Then, they were treated and immediately given apost-test (see Table 2). Afterwards, their results were compared (Sugiyono, 2010).
Table 2. The Procedure of a Quasi-Experimental Research Design
GroupsPre-test
Treatment
Post-test
Experimental group
O1
Worksheets-Oriented Instruction
O2
Control group
O3
Conventional Instruction
O4
Note :
O1 = Experimental group’s pre- test scores,
O3= Control group’s pre-test scores,
X = Treatment,
O2 = Experimental group’s post-test scores,
O4 = Control group’s post-test scores (Sugiyono, 2010)After the results of pre-test and post-test are gained, it is obvious that students' scientific literacy levels increase from pre-test to post-test. The normalized gain (n-Gain) is calculated using the following formula:
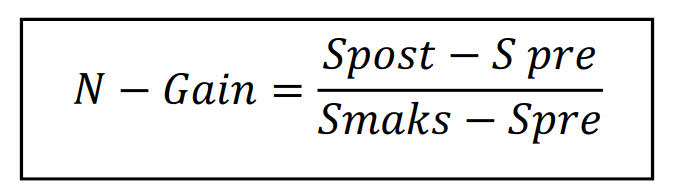
Note : Spost = post-test value, Spre = pre-test value, Smaks = ideally maximum value (Hake, 2002)
The normalized gain values of three classifications are presented in Table 3.
Table 3.Three Classifications of the Normalized Gain Value
Average Gain Normalized
Classification
Level of Effectiveness
<g> ≥ 0.70
High
Effective
0.30 ≤ <g> ≤ 0.70
Medium
Effective enough
<g> < 0.30
Low
Less effective
(Hake, 2002)
Independent samples t-test was used determine the effectiveness of the worksheets-oriented instruction via IBM SPSS Statistics 21 program. Then, percentages of the controls and experimental groups were counted on domains of scientific literacy. Both of the groups took the same test after the teaching intervention. Then, analysis of covariance (ANCOVA) was run for adjusting their learning scores to compare the experimental and control groups with one another.
