 |
Asia-Pacific Forum on Science Learning and Teaching, Volume 15, Issue 2, Article 4 (Dec., 2014) |
Survey models are research models in which participants declare their opinions on a subject or an incident. These models determine the features like interest, attitude and skill through huge samples in general (Fraenkel & Wallen, 2006).
Descriptive analysis method was used in this research. In the descriptive analysis method, one aims to reach a general judgment about the population that is composed of many components. By this means, descriptions on the variables of a unit and a situation occurring in a group or a sample could be taken from the population. (Arlı & Nazik, 2001; Cohen, Manion, & Morrison, 2000). In this research, descriptive analysis method was used to determine the change of primary school second level students' motivations towards science education according to the variables of gender, class, socio-economic levels, success in science-technology course and science-technology score.
The sample of the research consists of 413 (12-14 ages) second level students of the public school in the city centre of Ankara and Adana who are selected through a basic random sample during the 2013-2014 education year. In the most general context, basic random sampling means the selection of the sampling units randomly from the population list (Büyüköztürk, Kılıç Çakmak, Akgün, Karadeniz, & Demirel, 2008). 210 (50.8%) of the students in the research receive education in Ankara whereas 203 (49.2%) of these students receive education in Adana. Students in the sample participate in the research voluntarily. Distribution of students according to the cities and classes they receive education are shown in Figure 1.
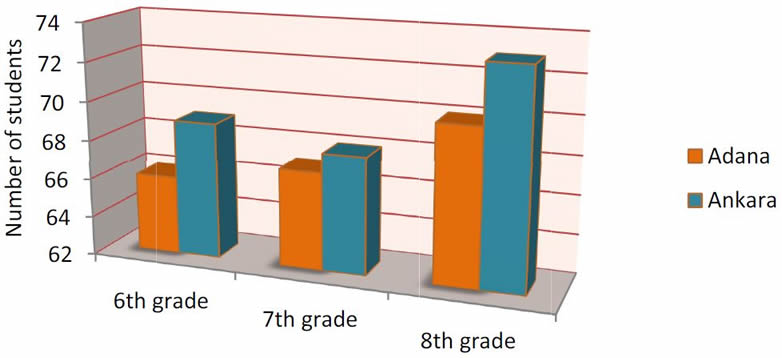
Figure 1. Distribution of students according to the cities and classes they receive education
As seen in the Figure 1, 69 (16.7%) of the students who receive education in Ankara continue the 6th grade, 68 (16.5%) of these students continue the 7th grade, 73 (17.7%) of these students continue the 8th grade. On the other hand, 66 (16.0%) of the students who receive education in Adana continue the 6th grade, 67 (16.2%) of these students continue the 7th grade, 70 (16.9%) of these students continue the 8th grade.
1. Motivational Learning Environment (MoLE) Questionnaire
In this study “Motivational Learning Environment (MoLE)” was used which is developed by Bolte (2006). The theoretical framework of the MoLE was explained in a study carried out by Bolte (1995; 2006). The MoLE questionnaire consists of two parts: The MoLE_REAL version and The MoLE_IDEAL version. The purpose of this questionnaire is to analyze the real and ideal learning environments (Bolte, 2012). REAL version focuses on how the students perceive their actual science lessons. On the other hand, IDEAL version focuses on how the students expect their science lessons to be (Bolte, 2006). The MoLE model consists of seven dimensions. Every dimension of the questionnaire contains only two items, which were evaluated by using a seven-point rating scale. The statements that correspond to our ideas about a “good” science lesson are coded with high numerical values (“7” to “5”), negative statements receive low numerical values (between “1” and “3”), while the scale value “4” corresponds to a “neither-nor estimation” (Bolte, 2006; Ferk Savec & Devetak, 2013). There are 14 questions in each version of the scale and in total there are 28 questions and minimum score that can be get from each version of the scale is 14 and maximum score is 98.
Although the statements in the original scale were prepared according to the chemistry, they could be easily applied to the science courses in primary education (Albertus, Bolte, & Bertels, 2012; Bolte, 2012). The statements that took place in the original of the scale consist of general judgments stating the opinions of the students about the “present condition of the chemistry courses (REAL) and how they should be (IDEAL)”. Thanks to this feature of the scale, one can easily use it in science courses of primary education as it was used in other disciplines of science. As a matter of fact, Albertus et al., (2012) assessed the results by applying the MoLE scale in the science classes in some parts of their researches in which they study about middle high school students' motivations towards motivational learning environment in science/chemistry classes.
In this context, validity-reliability analysis was carried out for the scale to be conducted to the second grade Turkish students of primary education.
The Turkish translation of the scale, which was done by DEU-PROFILES Working Group (2011), contributed to the language validity of this study. The steps below were followed respectively in order to realize the language and content validity analysis of each version of the scale.
- Two experts in the field of science translated the scale into Turkish and these translations were controlled by three philologists and joint sentences were formed for the statements that differ.
- Two philologists translated draft Turkish form into English again after these steps. The original English version of the scale and the version that was translated into English again were analyzed and co-decision is completed to determine whether there were any differences between them.
- After the adaptation of the scale to Turkish and validity of context of the scale is provided by three assistant professor experts in science education, conformity in terms of translation was accepted.
- Lastly, to determine the clarity of the items, the scale was conducted to the student groups comprising fifteen people attending to 6th, 7th and 8th grade. According to the answers given, the items were decided to be clear enough.
After the language and content validity of the scale were provided, the next step to follow is to realize the construct validity of the scale with the steps given below. We reached 245 primary education students to carry out these analyses.
- Item-total correlation was calculated to assess the distinctiveness of the items in two versions in determining students’ motivations toward science learning. For example, although the item-total correlation of all the items in MoLE_REAL version of the scale varies between .566 and .680, the item-total correlation of all the items MoLE_IDEAL version varies between .564 and .795. Minimum value for the item-total correlation of the scale should be .20. The items of which item-total correlation was .20 and higher was well fit in distancing the individuals and the items under this correlation value should be removed from the test (Büyüköztürk, 2007). The item-total correlation values in both versions of the MoLE scale indicated that items in each version were distinctive in measuring the motivation level of the students in science learning.
- In order to interpret the factor analysis values of construct validity of both versions of the scale, we first carried out KMO (Kaiser-Meyer-Olkin) value to ensure whether the sample size was enough. We also performed Barlett Test (Barlett Test of Sphericity) to define whether there was a correlation between variables. The results were named as perfect if the value of KMO test tended to 1, and called unacceptable as the values became under 0.50 (Pallant, 2001; Tavşancıl, 2002). As the result of the analyses, KMO value and Bartlett test result of MoLE-REAL were found to be 0.92 and 1345.008 (p<0.01) respectively. For MoLE-IDEAL version, these values were as 0.94 and 1345.008 (p<0.01) respectively. These findings ensured us that both versions of the scale were appropriate for the factor analysis of the data. The factor analysis revealed that MoLE-REAL version’s explanation rate of the total variance for single factor was 44.795% and factor loading was varied between 35% and 50%. For MoLE-IDEAL version, explanation rate of the total variance for single factor was 53.277% and factor loading was varied between 34% and 67%. 30% and above explanation rate of variance was accepted as standard in scale developing and adaptation (Comrey & Lee, 1992). Thus, according to the findings here, the construct validity of the scale was satisfied since the factor loadings of the statements of both versions of the scale were above 30%.
- To calculate the reliability of each version of the scale Cronbach Alpha method, which is one of the internal consistency methods, was employed. For this reason, the scale is conducted to 245 6th, 7th, and 8th grade students in total from Ankara who were selected randomly and who attained the secondary stage of primary school. Cronbach Alpha coefficient in terms of the total of the items in two versions of the scale, which was analyzed in the SPSS-11.5 program, was calculated as .76 for the MoLE_REAL version of the scale and as .77 for the MoLE_IDEAL version. These values could be said to be enough in terms of the reliability level, which is necessary for the use of measurement tools (Büyüköztürk, 2007).
As a result of these analyses, we are ensured that MoLE scale which was adapted to Turkish is valid and reliable enough in determining the motivations of students in science learning.
Although many motivation scales were used in the studies in Turkey, these scales measure the general motivation conditions of the students. This scale, which was developed by Bolte (2006) is different from the other scales in terms of determining how the motivation of the students consisting their general perception of science learning and how the motivation that is the part of the key of success should be in science courses. For this reason, the investigation of primary school students’ motivation toward science course in real and how it should be, would close a gap present in the related subject in Turkey.
Samples from the MoLE scale:
For REAL version: The topics in science-technology class are..................................... my everyday life.
very important to me very unimportant to me For IDEAL version: To me it is…
very important completely unimportant the topics which we talk about in science-technology lessons are useful for me (for my everyday life).
2. Personal Information Form
Moreover, “Personal Information Form” was used to reveal the socio-economic profiles of the students. In the personal information form, there exist variables like residential area/settlement, gender, grade level, educational level of parent, level of income, success in the course of science-technology and the last course score that the students get in science-technology course. Numerals were used for the description of the factors of each variant to help the analysis of some variables in the form. These are as the following;
- For the educational level of the parents; 1:illiterate, 2:literate, 3:primary school (1th-2th-3th-4th-5th), 4:secondary school (6th-7th-8th), 5:high school (9th-10th-11th), 6:undergraduate, 7:graduate.
- For level of income; 1:500-1000TL, 2:1000-1500TL, 3:1500-2000TL, 4:2000-2500TL, 5:>2500TL.
- For the success in the course of science-technology; 1:I am successful (over achievement), 2:I am neither too successful nor too unsuccessful (middle achievement), 3:I am less successful from my classmates (low achievement).
- Last score of science-technology course; 1:0-44, 2:45-54, 3:55-69, 4:70-84, 5:85-100.
The points that students receive from the both version of the scale were taken into consideration for the analysis of the data acquired from the scale of “Motivational Learning Environment (MoLE)”. 11.5-SPSS program was used in the analysis of data. From the descriptive statistics frequency (f)-percent (%), t-Test of independent groups and one-way variance (ANOVA) were benefited in the analysis of the data. In the analysis of the sub-problems of the study, total scores gained from both versions of the scale were considered. "N” that took place in the chart stands for the total number of students. Furthermore, in order to test the validity-reliability of the Turkish form of the scale, exploratory factor analysis and item analysis were performed and Cronbach Alpha coefficient was calculated.

Copyright (C) 2014 HKIEd APFSLT. Volume 15, Issue 2, Article 4 (Jun., 2014). All Rights Reserved.