|
Asia-Pacific Forum on Science Learning and Teaching, Volume 15, Issue 2, Article 2 (Dec., 2014) |
The roles of visualization in science education linked to Bloom’s Taxonomy
In order to promote higher-order thinking in education (i.e. analyzing and evaluating), Benjamin Bloom created Bloom's Taxonomy with the three identified domains (cognitive, affective and psychomotor domains) as educational activities (B. S. Bloom, 1956). In other words, these three domains can also be seen as knowledge, attitude and skills that learners ought to achieve through education. On the basis of the above-mentioned Bloom’s Taxonomy of the cognitive, affective and psychomotor domains, the roles visualization can play to benefit science teaching and learning are addressed as follows.
The cognitive domain
The cognitive domain involves knowledge and intellectual skills (B. S. Bloom, 1956). For example, recall and/or recognition of facts, interpretation of instruction and problems, application of knowledge to a new situation as well as making judgments on ideas. Here, the use of visualizations in science education relating to the cognitive domain has the role of not only making invisible concepts/ideas visible but also illustrating abstract concepts and making it concrete.
- Making abstract knowledge and ideas concrete
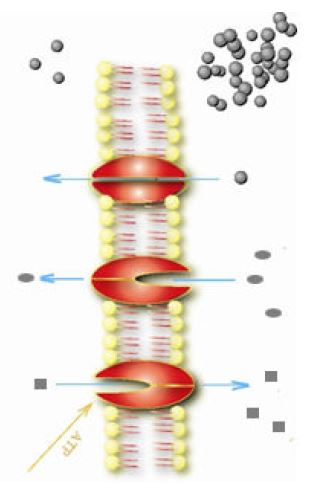
Basically, through visualization, complex or abstract knowledge and ideas can be expressed in effective and concrete ways that then can make learners encode and recall their knowledge easier. For example, the mechanisms of molecular transporting through the cell membrane are easily shown through visualization (Figure 2) instead of verbal representation. In this way, it might help to overcome the common problem concerning some students who have difficulties in reading (Mallinson, Sturm, & Mallinson, 1952).
Figure 2. The mechanisms of molecular transporting through the cell membrane (Cited from Rundgren et al., 2012, p. 910).
- Translating scientific ideas between macro, micro, and symbolic levels
Visualization is used to convey information that is not easily seen or is impossible to see with the naked eyes (Tversky, Zacks, Lee, & Heiser, 2000). In other words, visualization is to make invisible objects visible. Johnstone (1993) has pointed out that the models produced in science are expressed in three distinct representational levels including (1) the macroscopic level: such as snow that we can see on the roof of a building; (2) the sub-microscopic level: like the snowflake under a microscope; (3) the symbolic level: for example, H2O or H-O-H can be used to present the composition of snow. All the above-mentioned levels can be represented by visualization to make students learn science better.
- Showing the processes of scientific concepts
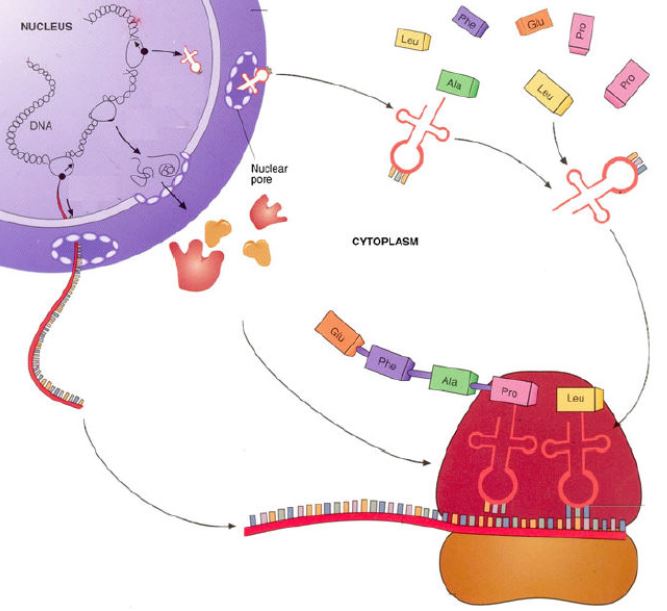
Visualization has its benefits in representing the process of scientific concepts explicitly via still images and/or animations (e.g. Rundgren et al., 2012). For example, the process of protein synthesis can be clearly presented by a still image (Figure 3). However, dynamic visualization can improve student understanding of abstract concept of molecular processes more than static illustrations. Research has shown that animations did help students to understand biomolecular process and the random nature of biomolecular interaction better (Rundgren & Tibell, 2010). Ryoo and Linn (2012) also found that dynamic visualization had the potential to enhance 7th graders’ understanding of the concept of photosynthesis compared to static illustrations. Similarly, animations have been found to have the same learning effect in chemistry education (e.g. Jones, Jordon, & Stillings, 2005; Sanger & Greenbowe, 1997; Williamson & Abraham, 1995)
Figure 3. The visualization of protein synthesis by an original of Mix/Farber/King (Cited from Rundgren et al., 2012, p. 911).
- Modeling process and visualization
The modeling process and visualization have been the fruitful subject of scientific research. In science education, modeling and visualization are important mental skills for students to develop, esp. while learning science. Gilbert (2008) argues that students need to learn the skills of explaining and understanding historical models and contemporary models in science; learn to develop new qualitative models, which is a major task for scientist as an inquiry into a hitherto unexplored phenomena; learn to develop new quantitative models of qualitative models to produce a comprehensive representation. By using visualization in science teaching, we hope to help students to develop intellectual skills, such as modeling, in learning and developing science.
The affective domain
According to Krathwohl and colleagues (1964), the affective domain includes emotion, attitude and value. In other words, receiving, responding and showing feelings, values, appreciation, enthusiasm, motivation, and attitudes are all embraced in the affective domain. Based on the perceptual theory applied in the field of visualization, the role of visualization can (1) attract student attention and induce emotion via the colorful visual representations combined with audio/verbal representations, and (2) make students enthusiastic by engaging them in an interactive visual environment, i.e., a game-based learning environment.
To gain student’s attention, the first stage is perception. The perceptual theories have indicated that perception and action are central to the cognitive processes involved in the brain system (Barsalou, 1999; Glenberg, 1997; Zwaan & Yaxley, 2004). Here, representations can be seen as modality specific: tactile experiences lead to representations that encode touch (Rapp & Kurby, 2008). Mental representations (or IR as we mentioned earlier in this article) are directly linked to the real world concepts and sensory perceptions to what we have experienced (Barsalou, 1999; Glenberg, 1997; Hesslow, 2002; Lakoff & Johnson, 1980; Svensson & Ziemke, 2004; Zwaan & Yaxley, 2004). When representations embrace different perceptual sources, they become multimodal, which can be linked to the Dual-Coding theory (Paivio, 1971, 1986). However, cognitive load theory has also proven useful in the visualization of instructional design (Cook, 2006)
The psychomotor domain
Physical movement and coordination are embedded in the psychomotor domain (Simpson, 1966). The embraced skills demand practice and are judged in terms of speed, precision, procedures, or techniques in the execution. The roles of visualization linked to the psychomotor domain are:
- Enhance students’ spatial skills
Visualization research in science education has shown that learners’ spatial skills and prior knowledge are related to the use of ER in science learning (e.g. Wu, Lin, & Hsu, 2013). Even though visualization demands spatial skills, it might be a useful way to improve learners’ spatial skills via visualization.
- Externalizing students’ ideas and enhance communication skill
Drawing has been used to investigate students’ understanding of science for a long time. Drawing is seen as a meaning-making medium (Brooks, 2009) as well as a ‘shared reference point’ (Tytler, Prain, & Peterson, 2007). In science education, ‘concept map’ and ‘V-diagram’ are used to teach and construct ideas (Novak & Gowin, 1984). For example, a concept map is a useful tool to externalize students’ conceptions regarding homeostasis of blood sugar (Chang, 2007) as well as discussing students’ own ideas on the water transport concept through drawing (Rundgren et al., 2010). Through externalizing ideas via visual representations, a ‘shared reference point’ to enhance communication skills is established.
- Promoting students’ sensory perception
By combining the five senses of smell, sight, taste, touch and hearing, we can learn better. Visualization is traditionally associated with what we see, yet research reveals that we can generate an image without seeing visuals (Reiner, 1999) mainly through touch. This suggests that visualization processes can be enhanced by adding or replacing visual information with other sensory modalities. A combination of touch and visual cues is beneficial to learning. Haptic learning is one example of learning enhancement (e.g. Schönborn, Bivall, & Tibell, 2011). Also, through color perception, students can represent each element involved in the concepts and encode easily (i.e. Figure 3). However, color perception might cause misconception for younger kids, which will be discussed in the following section concerning teachers’ professional knowledge to show what aspects teachers ought to be aware of while using visualization.
In sum, before adopting a visualization in science teaching, it is important for teachers to reflect upon Bloom’s Taxonomy and concern about how students’ cognitive, affective and psychomotor domains are going to be developed and related through the chosen visualization.