|
Asia-Pacific Forum
on Science Learning and Teaching, Volume 12, Issue 2, Article 9 (Dec., 2011) |
The pilot study was carried out after the students had been taught Electrochemistry by their Chemistry teacher. Hence, the researcher assumed that the students have already had some existing knowledge regarding the basic concepts of electrolytic cell. The researcher expected to get moderate performance from the students for the specific entry test and pretest since they had already learnt the topic. Surprisingly, the students’ results were very poor. Half of the students failed the specific entry test and all of them failed the pretest.
Marks (per 100) Frequency (n)
Percentage (%)
10
2
5.7
20
7
20.0
30
8
22.9
40
6
17.1
50
5
14.3
60
6
17.1
70
1
2.9
Total
35
100.0
Table I: Students’ results for the specific entry test
Specific entry competencies are prerequisite knowledge, skills and attitudes that learners must possess to benefit from the training (Morrison, Ross & Kemp, 2007). The specific entry test in this study tested the students on some basic knowledge and skills that they have to master before they study Electrochemistry. The basic knowledge and skills are related to proton number, nucleon number, arrangement of electrons, chemical formulae and chemical equation. They need to have the skills to write chemical formulae and chemical equations in describing the process that takes place in the electrolytic cells. The students’ results ranged from 10% to 70%. The results showed that the students were still weak in writing chemical formulae (Item 2, only 22.9% of the students answered correctly and for Item 8, only 17.1% of the students answered correctly) and the concept of proton number (Item 9, only 20.0% of the students answered correctly). The students who failed the specific entry test were given remedial help before they started with the treatment sessions. They were given some revision notes for Chapter two – The structure of atom and Chapter three – Chemical formulae.
Achievement tests were given in the form of pretest and post-test before and after the intervention to study the effect of IMMPA EC Lab on students’ understanding in Electrochemistry. Table II below shows the t-test results for the pretest and posttest.
TestN
Mean
Std. Deviation
t value
Sig (2-tailed)
Post test
35
26.98
13.61
8.97
0.000*
Pre test
35
9.42
5.71
Table II: t-test table for the students’ achievement tests
A paired-sample t-test was conducted to evaluate the impact of the IMMPA EC Lab on the students’ scores in the achievement test. There is a statistically significant increase in the achievement test from the pretest (M = 9.42, SD = 5.71) to the post-test [M = 26.98, SD = 13.61, t(34) = 8.97, p < 0.05]. The magnitude of the difference in the means is very large (eta squared = 0.5419) (Cohen, 1988). Although the overall results for the post-test are better compared to the pretest, 85.7% of them still failed the posttest. The results for the posttest ranged from 3.70% to 77.78%.
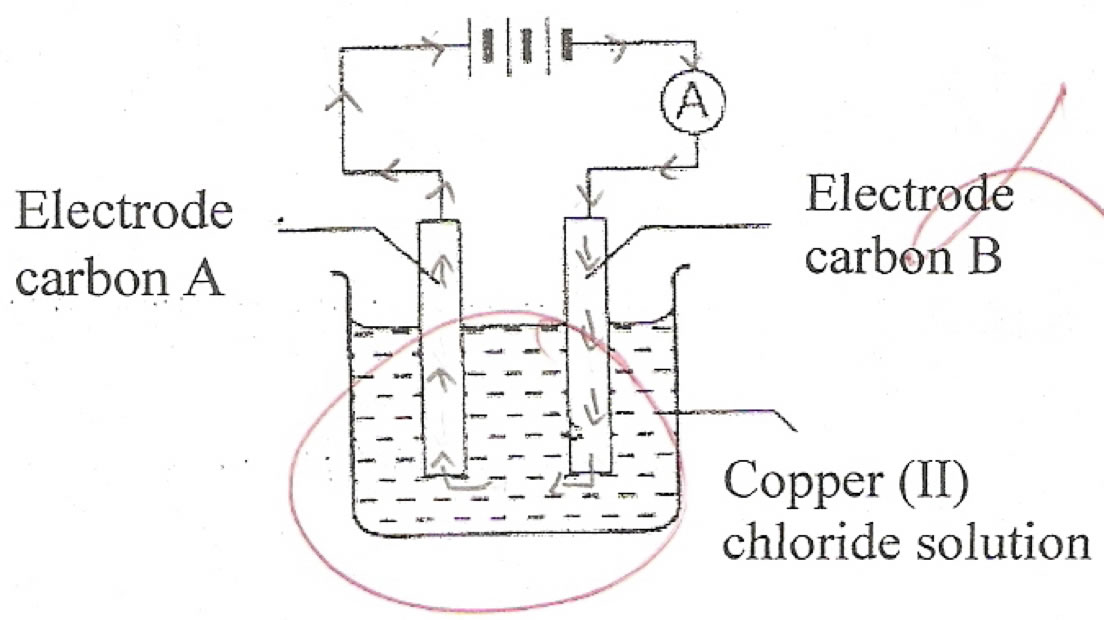
The students were still weak in certain concepts in Electrochemistry especially at the microscopic and symbolic levels. For instance, the students still cannot differentiate between the flow of electrons in the conductors and the flow of ions in the electrolytes (Lee & Mohammad Yusof, 2009; Lee, 2008; Özkaya, Üce & ?ahin, 2003; Sanger & Greenbowe, 1997a). Only 14.3% of the students can answer Item 1 c (i) which asked the students to draw the direction of the flow of electrons in the electrolytic cell. The majority of the students drew the electrons in the electrolyte (see Figure 4) and some of them drew the electrons in the opposite direction. However, students’ results showed increment from pretest (2.9%) to post-test (14.3%) in this item indicating that the animations in the Micro-World help to assist the students in understanding the movement of electrons microscopically.
Figure 4: Electrons flow in electrolyte
The students were also confused between the processes that happened at the anode and cathode during the electrolysis process. Students always assume that anions will be attracted to the cathode while cations will be attracted to the anode (Lee & Mohammad Yusof, 2009; Lee, 2008). This is because anions are negative ions and the students in this study assumed that negative ions will be attracted to negative electrode and vice versa. The students’ misconceptions of this concept were revealed in Item 1 e (i) and (ii). About 22.9% of the students answered both questions correctly in the post-test compared to only 2.9% of them answered correctly during the pretest.
The students were also confused about which ions are to be discharged at the electrodes. They cannot determine the factors to be considered when they answered the question. For instance, the students need to consider the effect of the concentration of ions to determine the ions to be discharged at the electrodes for Item 1 l. However, the majority of them failed to give the correct answer. Only 5.7% of them could give the correct observation at the anode and only 17.1% of them could give the correct observation for the colour change in the cell. Some of the students could give the correct observations at the electrodes, but they failed to give the reasons for their answers.
Overall, students’ conceptions improved after the intervention especially in microscopic and symbolic levels. Descriptions of students’ answers for some Electrochemistry concepts during the pretest and posttest are presented at Table III below.
Electrochemistry concepts Pretest’s answers
Posttest’s answers
The flow of current in the conductors and in the electrolytes [Item 1 c (i)]
- Electrons flow in electrolyte
- Electrons flow from cathode to anode
- Electrons come out from both electrodes
- Electrons flow from anode to cathode
Process at the anode and cathode [Item 1 e (i), 1 e (ii)]
- Anions accumulated at cathode
- Cations accumulated at anode
- Absence of ions from water molecule
- Anions accumulated at anode
- Cations accumulated at cathode
- H+ ions and OH- ions are included in the answers
Concepts of oxidation and reduction process at the electrodes [Item 1 g (i), 1 g (ii)]
- Oxidation equation at cathode
- Reduction equation at anode
- Wrong / incomplete half equations
- Oxidation equation at anode
- Reduction equation at cathode
- Correct and complete half equations
Concept of electrolyte [Item 1 d]
- Absence of ions from water molecule in the electrolyte
- H+ ions and OH- ions are present in the electrolyte
Table III: Comparison of students’ answers for pretest and posttest
The motivation questionnaire was used to assess the students’ goals and value beliefs for Chemistry (especially Electrochemistry), their beliefs about their ability to succeed in the subject and their anxiety toward the test and examination on Electrochemistry. Constructs involved are intrinsic goal orientation, extrinsic goal orientation, task value, control of learning belief, self-efficacy for learning and performance and test anxiety. Table below shows the t-test result for the motivation questionnaire in the study.
Questionnaire N
Mean
Std. Deviation
t value
Sig (2-tailed
Post
35
3.68
0.34
2.42
0.021*
Pre
35
3.53
0.32
Table IV: t-test table for the students’ motivation level
Table IV shows that there is a statistically significant increase in the level of motivation from the pre-questionnaire (M = 3.53, SD = 0.32) to the post-questionnaire [M = 3.68, SD = 0.34, t(34) = 2.42, p < 0.05]. The eta square is 0.079, which is considered as a moderate effect size (Cohen, 1988). Overall, the students’ motivation level increased for each construct in the motivation questionnaire except for the test anxiety construct which maintained the same. The mean value for Self-efficacy for learning and performance construct showed the biggest increase from 3.30 (SD = 0.42) to 3.54 (SD = 0.50) after the students studied with the EC Lab. Self-efficacy refers to personal beliefs about having the means to learn or perform effectively (Zimmerman, 2000). High self-efficacy beliefs enable the students to be more motivated to learn Electrochemistry and hence their test anxiety level is low (M = 2.06, SD = 0.67). High self-efficacy values are related to relatively high intrinsic motivation values. In this study, the students’ intrinsic goal orientation value is 3.84 (SD = 0.48), showing that the students enjoyed learning with the EC Lab. The variety of feedback given by the PAs and the videos shown during the discussions attracted the students’ attention to study the topic. The students showed the highest extrinsic goal orientation (M = 4.54, SD = 0.40) among all the constructs, indicating that they were trying to show to others that they can perform well in Chemistry.