|
Asia-Pacific Forum
on Science Learning and Teaching, Volume 11, Issue 2, Article 8 (Dec., 2010) |
Video analysis as a tool for developing skills to read and create kinematic graphs
4.1. A brief history of using video in science education based on Kearney and Treagust (2001):
The use of video in physics education dates back to the 1950’s. At the beginning, the use of video was limited to students’ passive observation to well and carefully designed educational films showing and explaining physical phenomena. Such educational films were developed, for instance, by the well known Physical Science Study Committee (PSSC) series of films. Later on computer-controlled digital video were introduced in physics education, in which the user could do more than just press the 'on-off' button. For instance, the user could select or play a segment or individual frame (picture) with minimal search time; 'still frame', allowing any frame of the video clip to be clearly displayed for as long as the user wished to view it; 'step frame', enabling users to display the next or previous frame; and 'slow play' enabling the user to play the video at any speed up to real time in a forward or backward direction. Today, with the development of digital cameras and appropriate computer programs a more complex connection between the video film and the computer are possible. For instance, Kearney and Treagust (2001) describe an interactive digital video computer program that makes use of digital video clips of appropriate physics demonstrations as part of a predict-observe-explain sequence. The program does not allow the students to view the video of a demonstration (the observation phase) until their predictions and reasons are completed.
Video analysis takes the video clips one step further. Instead of showing the student some scientific phenomena, it allows the students to actually collect data from the video itself with an appropriate computer software program. For instance, one can collect data concerning the location of an object – vertical and horizontal – versus time. This can be done by simply clicking on the object after entering scale data. So, in a sense, the video analysis is a kind a laboratory where students can collect data and analyze it. Moreover, the data can be collected in tables and graphs which are presented simultaneously to the user. The user can also do mathematical manipulations on the data. For instance, he or she can easily find the velocity at each point of the graph by making derivations of the distance time graphs. Using these computer programs transform the film to a kind of a laboratory where the students can collect data. Moreover, it actually enables one to collect data more easily than in real life. How, for instance, would you collect data regarding the heights of a basketball during its motion in a real environment? So, the package of the software together with the film may be considered as a kind of laboratory itself. In addition, the clips can show dangerous, difficult, expensive or time consuming demonstrations not possible in regular laboratory (Hardwood & McMahon, 1997). In what follows, the advantages of using video analysis are discussed. Then, an example is provided to show how these benefits are manifested. However, if the reader is unaware of video analysis technology it is recommended that he or she will first read the example in section 4.3 and then read section 4.2 and reread section 4.3.
4.2. Advantages of using video analysis
4.2.1. Video analysis encourages students to connect school and out-of school experiences
By requesting the students to view a video of a phenomenon depicting a physics principle and analyze it, they are encouraged to refer to real life situations and not only to ideal situations with ideal objects as presented at school. For instance, while learning on projectile motion students are usually introduced with a movement of, say, a bullet or a rocket in the air. The bullet or the rocket is usually drawn as a small circle on the board. Also it is noted that the air friction is ignored and that there are no winds in the situations. This means that only ideal situations are dealt with where no wind forces or air resistance affect the objects. In other words, usually, physics teachers as well as physics textbooks refer to "ideal" objects of boxes or circles in "ideal" situations (Eshach, 2009). By doing so, physics, in my opinion, is presented to the students as being detached from every-day-life. On the one hand, one may say that physics is difficult enough to deal with, even in such ideal situations, so we must avoid the complexity of real situations. In general I agree with this notion. However, on the other hand, I feel that students should also, at least to some extent, be introduced to more complex situations in real life contexts. In that way they will feel physics to be not just a collection of formulas and principles which are valid only for school exercises and exams, but rather as relevant to everyday life phenomenon.
While connecting school science with students' everyday lives may seem simple and plausible, it is in fact complex and requires that the students will deal with daily life situations rather than just deal with such problems that requires manipulating learned formulas, like those which usually appear as an exercise at the end of the learned chapter (Cajas, 1999). Mayon and Knutton's (1997) systematic work on school science and students' out-of-school experiences found that only few teachers were able to connect school science to students' out-of-school experiences. According to Eshach (2009) one possible reason for this is the lack of teaching methods that help teachers connect students' real life to what they learn in school. It is my opinion that video analysis is such a tool that may enable teachers to provide their students with opportunities where they can bring the out-of-school experiences into school physics. Moreover, students not only bring out-of-school phenomena to the class they may also choose them. They themselves may decide what videos scene depicting everyday physics phenomenon they want to record. I believe that when students themselves have the freedom to choose what scenes they want to analyze, their motivation to learn may increase. But besides the motivation, the fact that the students themselves choose the scene to be analyzed also provides an opportunity to discuss with the students whether their choices themselves indeed depict the learned principles. In other words, the choosing of the scenes allows the teacher to see whether the students apply well the physics principle in the real phenomena they choose. For instance, students may choose to analyze a video of an airplane to demonstrate projectile motion. This may enable the teacher to discuss with the students the differences between objects whose movement is influenced only by external forces such as gravity and those which move under the influence of internal forces in addition to external forces, such as in the case of an airplane whose movement is influenced by gravity, air resistance, but also by its engine.
Another point related to the problem discussed above, namely, that teachers present to their students only ideal situations with ideal objects, is that as an ensuing result of such practice is that students find it difficult to identify the relevant entities in real phenomena accounting for the objects' behaviors. An instance of this phenomenon was reported by Eshach (2009) in the context of Newton Third Law. One of the students' identified misconceptions was that they believed that a rocket can fly to the sky due to the impact of the rocket's gases on the ground. The author argued that understanding the idea that the ground is not necessary for enabling a rocket to take-off can be achieved only if the ‘irrelevant’ entity—the ground—is ‘in the picture’, so to say. In other words, to enable students to fully understand concrete physical phenomena, the teacher should refer not only to ideal objects in ideal situation but rather also to "irrelevant" entities and discuss with the students why these entities are relevant or not relevant, and why they are ignored (in cases they are indeed ignored) in the physics analysis process. By relating to real situations, the video analysis, by its very nature, exposes students to both relevant and 'irrelevant' objects.
4.2.2. Video Analysis enables students to better connect graphs to the real world
Pozzer and Roth (2003) argue that inscriptions lie along a continuum depending on the amount of contextual detail they carry. More contextual detail indicates they are closer to the world (“real”, “concrete”), and less detail that they are closer to signs (“abstract”). According to the authors, while scientific equations and graphs lie on one side of the continuum, indicating more abstract, less detailed information, drawings and photographs lie on the opposite side, indicating less abstract, more detailed information. Video analysis provides a simultaneous video of the scene, a table recording the moving objects' x and y positions, and graphs representing the x and y positions versus time. Obviously, the short video scenarios lie on the more concrete side of the continuum. They are "closer to reality" than photographs since they also portray dynamic scenarios. In this case the dynamic relationships between the different objects belonging to the physics' phenomenon demonstrated in the video scenario are presented. The table and the x and y position graphs are more abstract representations. So, concrete and abstract inscriptions appear simultaneously.
Another advantage of using videos is that students can control the number of times they want to see the video recorded phenomenon. They can also control the pace of the scene. By clicking on the mouse pad they can see the video scene frame by frame and at the same time view the relevant graph and table data on the computer screen. Moreover, there is a connection between these three representations. For instance, the user can operate the video scene frame by frame. The position of the object in each video frame shown on the computer screen is simultaneously connected to the x and y graph positions since the appropriate points on these graphs are highlighted. As well, the appropriate row in the table containing the data of these points is also highlighted. So, the user can connect the position of the object he or she sees in the video scene to the location of that same position in the x and the y graphs. When, by clicking on the mouse pad, the user changes the frame, again, simultaneously the highlighted points on the graphs will change in tandem and the points representing the position of the object in the video scene will be highlighted. In that way, three representations of the object's position are presented simultaneously: the video scene – where the position of the object in relation to other objects' positions in the scene are presented; the position of the x and y graphs versus time – in which other objects' positions are not part of the presentation and the relationships between the other objects in the scene are absent. Thus, to understand the graph the reader needs to make an abstraction of the real world, which involves perceiving the symbolic graphical entities as separate of the object to which they represent; but at the same time to have the ability to connect these symbolic entities to that real world that they represent. This task might be very difficult for novices. While looking at the graph, the reader needs to construct a mental image of the physical world it represents. This might require a dynamic mental image which involves the relations between the positions of the different moving objects as represented by the graph. For instance, looking at the parabolic graph of y-position vs. time of a falling ball, in the absence of the falling ball itself, requires the reader to imagine a ball moving in straight vertical line in such a way that the y-distances increase as time goes on. However, when the graph is presented simultaneously with the video scene, and moreover, when the position of the object on the video scene fits to its position on the graph, it makes it easier for the reader to connect the two representations and as a result to better understand the meaning of the graph.
4.2.3. Video analysis provides opportunity to construct “bodily” knowledge
In opposition to past sharp distinctions between body and mind, modern research addresses a certain kind of knowledge often termed “body knowledge” – a kind of knowledge reflected in motor and kinesthetic acts (Reiner & Gilbert, 2000). Such knowledge is said to be “stored” in our body perhaps even impacting our cognitive behavior including our understanding of scientific concepts. The importance of bodily knowledge is supported by current cognitive psychology theories where non-verbal mental representations of knowledge in memory, in different modalities, account for how we think and are at least as fundamental as verbal presentation. Reiner (1999) explains the concept of bodily knowledge through the example of a tennis player, where even a novice player can raise his racket accurately in order to hit an incoming tennis ball, regardless of his knowledge or lack of knowledge of projectile motion. The body "knows" how to move the hand so as to hit the ball in such a way that it will land in a pre-determined location of the other player's domain, perhaps even at a certain velocity and angle. If asked, chances are the player will not be able to supply a well structured propositional response. (Reiner, 1999)
Eshach (2006) argues that educators should be aware of the importance of body knowledge and that they should provide students with appropriate sensomotoric experiences which could constitute a solid basis on which the correct scientific concepts may be later constructed. Indeed, sensory interactions with the environment have been considered as crucial for the development of higher reasoning skills across domains (Piaget, 1954, 1976).
I argue that video analysis provides the students with the opportunity to build for themselves efficient body knowledge that may serve as a basis for further development of scientific concepts. To analyze the object’s movement, the user needs to click on the object where it appears on the computer screen. Then, the data concerning this location is recorded and the object moves to its next location. Now, to record the new location the user needs to move with his or her hand holding the computer’s mouse to the next location. I argue that this movement is exactly the kind of “body” knowledge which is “stored” in the user’s body. Let’s take for example a scene of a falling body. The user clicks on the falling object's first location. Now the user needs to move the computer mouse to the next location and to click again. This process continues a number of times. Each time the user needs to move the computer mouse a longer distance. So, the “body knowledge” is such that the movement of the hand increases as we get down. For another example see section 4.3. where the example of a thrown basketball is explained in detail. It is my belief that the teacher should draw the students’ attention to these kinds of body knowledge and ask them to explicitly describe their hand movement each time and to try to explain why they moved their hand in the way they moved it. In such a way the students will be able to efficiently connect between their body knowledge and their conceptual understanding. I will further elaborate on this topic in the “Where next” section.
4.2.4. Video analysis enables teachers to increase student awareness of the impact intuitive rules may have on
their graph reading and creating skillIn section 4.2.2 I explained how the simultaneous appearance of the phenomenon's video scene and the table and graph representations make it easier for students to connect the graphs to the real world. For the same reason, video analysis may also assist students to overcome other difficulties as well. As mentioned, Eshach (in submission) suggested the intuitive rule theory as a theoretical framework explaining some of the difficulties students have in reading and creating of graphs. For instance the author argued that the Same A – Same B intuitive rule may account for the students' interpretation of the graph as being a “picture”. The use of video analysis may assist students to realize that the graph and the video representation of the object's trajectory on the video screen may not be the same. For instance, let’s consider the free fall of a ball. The students can see that while the free falling ball moves in a vertical axis only, meaning that its physical path is a vertical line, the y-position vs. time graph created on the graph screen is a parabolic one. This means that the ball’s physical path and the y-position vs. time graph do not have a similar shape. Following the idea of explicit teaching (Zohar & Peled, 2008; Zohar& Ben David, 2008), I recommend that the teacher explicitly discuss with the students this fact. Explicit teaching regarding the impact that the intuitive rules may have on our decision making processes may be efficient in increasing students' awareness to this phenomenon. The example described in detail bellow (in section 4.3.) of a thrown basketball is another interesting example since the y(position)-time graph and the video scene path of the ball have similar parabolic shape; however, the x(position) -time graph is linear. So, the students can realize that while there are indeed cases where the shape of a graph may be similar to that of the physical path of the object, the two are not necessarily related and in fact they usually have different shapes.
As regarding the More A-More B intuitive rule the teacher can refer to the scene presented in graph 1 section 3. In this case the videotaped scene can be one in which two moving objects move in two parallel straight paths, with the faster object starting at a point behind the slower object. In this case the distance-time graphs of the two objects will be similar to that in graph 1. Then, by creating the velocities vs. time graphs the students can see that the velocities of these two cars are two horizontal lines one above the other. The teacher should discuss with the students the differences between the position and velocities graphs, as well as mention the impact intuitive rules may have on the students' decisions regarding the cars' movement. I argue using video analysis may be an efficient tool for this purpose.
4.2.5. Video analysis promotes know-how of constructing a physics entity’s graph from another given graph
One of the students' difficulties, as explained, is creating a graph of a certain physics entity (e.g. velocity-time) based on another given entity (e.g. position-time). For instance, many students decide that the shape of the velocity-time graph of an object will be similar to its position-time graph. The use of video analysis can assist in this regard. By a simple procedure that includes finding the right regression line fit (e.g. quadratic fit) and then conducting a mathematical manipulation on it (e.g. derivation of the x-t to create the v-t), the new graph appears on the computer screen simultaneously with the original graph. Moreover, by clicking on different points on the new graph with the computer mouse, the parallel locations of the object in the new graph will be presented on the screen; and as well the appropriate points on the original graph will be highlighted. This will enable the students to realize that the graph of the new entity might have a different shape. As mentioned, it is suggested that the teacher explicitly refer to this point. Let's take for instance a scene of a ball thrown up vertically. After creating the y-position vs. time graph the student can create the vy-time graph. He or she can realize that while the movement on the video screen is only vertical, the y-t graph has a parabolic shape, and the velocity is represented as an inclined linear line. The example provided below in section 4.3 further sharpens this point.
In addition, one important thing that the learner should know is that the creation of the new entity's graph (say the velocity-time graph) is obtained by mathematically manipulating not the original graph itself, but rather the fitted regression line of that graph. With the aid of video analysis this point can be made very clear since one can easily realize that mathematical manipulations on the original graph gives results that are too far from those expected, while mathematical manipulation on the regression line yields a graph close to that expected. It should be pointed out that this point is not trivial. Foster (2004) found it may be a challenge for even students aiming to become Ph.D students. The teacher can use this video analysis feature to discuss this point with the students.
4.2.6. Video analysis promotes the understanding of scales and frames of reference
The first step in working with the video analysis program should be to fit the distance between the pixels to that in the scene. To do so, the user needs to include in the video scene an object with a known length. For instance, if the user videotapes a scene of the freefall of a ball, he or she should include a note indicating the height of the point from where the ball was released. Then, the first step of working with the video analysis would be to point the computer mouse to two points on the screen that the length between them is known, and input this length to the program. For instance, in a video of a free-falling ball scene, the user should know the height of the ball before it was thrown to the ground and this height should be inputted to the program. By doing so the program now "knows" to calculate the different x and y locations of the object.
Discussing this program requirement with the students as well as the fact that they need to ensure that they know the length of an object in the scene has its educational advantages. It teachers students that any measurement system, and the video analysis system can be considered as one such system, needs to be scaled. Another thing that the user needs to do is to decide on the reference point. For instance, in the freefall example, the reference point can be the release point of the ball, the floor, or any other point in between the floor and release point. The video analysis enables the students to easily change the reference point and examine how this might influence the collected data. In the freefall case, for instance, if the reference point will be the ground the y-position graph will be above x-axis and therefore will be positive, and if it will be the release point the graph will be bellow the x-axis and therefore be negative. The student can consider each time another reference point and immediately check how this impacts the graph’s shape. Usually, in a regular class the teacher refers to only one reference point and there are no discussions as to the impact reference points may have on the graphs and results. It is my understanding that such activities, which are easy to carry out with the use of video analysis, are important for leading the students to a deeper understanding of the meaning of reference points.
So far I have explained the benefits of video analysis in teaching kinematic graphing. In what follows I will provide a detailed example and show how the benefits discussed above are expressed in the example. In that way, I believe, the reader will have a better holistic understanding of the potential video analysis possesses.
After teaching a unit on falling bodies and trajectory motion, the teacher can ask the students to think of a relevant scenario of a moving body in the air and analyze its motion. As has been said, the fact that the students have the freedom to choose the scenario, which in their opinion depicts the learned principle, can itself enlighten the teacher as to what the students consider being suitable cases. Now, let us say the student is interested in basketball. He or she can choose to videotape a basketball thrown to the hoop and analyze its motion. The fact that the student chooses him or herself a scenario taken from his/her daily life experience facilitates connecting school science and everyday life. Furthermore, the fact that the student has an interest to explore might increase his or her motivation to learn the topic. It is not any longer an object moving in the air but rather, it is a basketball that is moving to the basket. After taking this short video movie, the student needs to open it by using the software. When the software is opened three screens appear: the movie screen, the table screen, and the graph screen. The movie screen is where the movie is shown. The movie can be played continuously or frame-by-frame. To begin the analysis the student faces the first problem - the basketball is not an abstract point but one having a certain volume. So, the student should now decide the point on the basketball he or she needs to consider. There is a kind of a "dialogue" between the real and the "ideal". For instance if the students chooses to relate to the basketball's middle point he should explain why he thinks this is a good point in terms of center of mass. The student also needs to think of scales and know the height of the basket, and insert this information into the program so that it will "know" how to calculate the position of the ball. Now the student needs to play the movie frame by frame in order to choose the reference point. A possible convenient point is the point where the ball leaves the hands. The fact that the student need to first relate to the scale and reference point develops his or her understanding of what scales mean and that the measurements may be different depending on the determined reference point, including negative and positive values.
To better understand the influence of the reference point, the students should change it and see how the graphs change. The student needs also to gather data regarding the ball movement. To do so, the student needs to bring the computer mouse's arrow on the basketball and click on it. Doing so, the program records this point. The x and y positions as well as the time will appear in a table on the table screen, as well as on the graph screen. Repeating this procedure, let’s say until the ball reaches the basket, the x and y positions of all the points the student clicked on will appear in the graph and the table as well as on the movie screen. In the process of clicking the computer mouse on the different ball's location the students move their hands. While the ball is moving upwards from the hands to the highest point in the trajectory the distances between the clicking points are decreasing, and from that point to the basketball the distances are increasing. The fact that the student's hand moves to different distances in accordance with physics law, I believe, creates such a bodily knowledge which might help understand the physics laws. For this to happen efficiently, the teacher should ask the students to pay attention to their hand's movement and even describe it verbally.
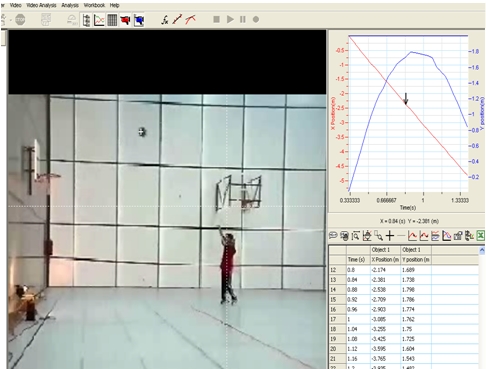
One of the significant difficulties in reading graphs is connecting it to the real world. Usually, while the graph represents the real world, it is separated from it. Usually the data which was gathered by the students in the real world is presented afterwards using graphs and tables. The real world is no more in front of the students. He or she, therefore, may find it difficult to connect the points on the graph to the real world. Using video analysis technology enables students to connect the three different representations: real world, table and graph, which appear in front of the students simultaneously. Moreover, when the student is clicking on a point on the graph, the movie screen will show the ball at its exact position in real world. Also, the row on the table which records the data belonging to this same point on the graph is also highlighted. So, in front of the students are three representations of the same point – its location in the movie (the real world), the point on the x-time and y-time graphs, and the data of that point in the table. This enables the student to better connect between these three representations. Figure 1 shows the three screen which appears in front of the students at one ball’s position labeled A in the movie screen.
Fig. 1: The three screens shown to the students when analyzing the movement of a thrown basketball to the hoop. The graphs and screens are created by Fourier Systems video motion analyzer which is part of their Multi-lab software
As can be seen in the graph screen there are two graphs (in different colors), x-position, and y-position, both versus time representing the ball’s x – horizontal, and y- vertical positions at each time interval. As can be seen in the graph screen, there is an arrow on x-position versus time graph. This arrow shows the x-position of the ball that belongs exactly to the place it is located in the movie screen. If the student will move the arrow on the graph the ball will move to another position accordingly. The same will happen if the student moves the arrow on the y-position graph. In addition, at each situation the relevant row in the table will be highlighted (this is not shown in fig. 1).
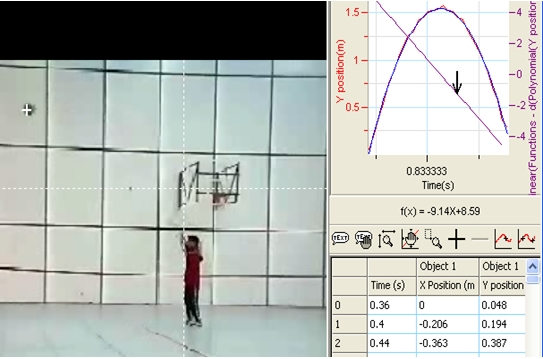
The fact that the three representations, the video-movie, the graphs and the table are presented simultaneously, that each ball’s position in the movie is related to a specific point on the x-position vs. time and on the y-position vs. time graphs, and that the numerical data of that same point is highlighted in the table enables connecting the different representations in the learner's mind. Now, to extract the vertical velocity (Vy), one should first find the best quadratic polynomial line that fits the y-position line and then find its derivation. Of course, for pedagogical purposes, it is advised that the teacher will also relate to the original y-t graph and not only to its best fit polynomial line and discuss the differences. Returning to creating the Vy graph by referring to the best polynomial fit line, this can easily be done with the video analysis software by first bringing the arrow to one point on the y-position vs. time graph and then clicking in the derivation baton. Fig. 2 is what the student will get after following the above procedure. To make it easier to read, position x vs. time graph was removed. The velocity’s graph and its equation are shown in Fig 2.
Fig 2: Extracting Vy-time graph from Y-position- time graph of a basketball thrown to the hoop. The graphs and screens are created by Fourier Systems video motion analyzer which is part of their Multi-lab software
As was explained, one of the difficulties students face when reading kinematic graphs is extracting one entity’s graph from another. Students, because the activation of the Same A – Same B rule tend to decide that the velocity-time graph shape should be the same as the position-time graph. The video analysis technology enables students to simultaneously see the movie, and the Vy-time and Y-position-time graphs. In this way students can immediately recognize that the graphs are different. They can also point at a specific point on the movie screen and see what points on the Vy-t and y-t graphs are associated with it. They can easily see that while the y-velocity changes linearly, the y-position does not. Also, the student can clearly see that while the y-position receives positive values (since its movement in this time period is in the positive part of y axes), the velocity changes direction when the ball reaches the highest position. This is a point that is very difficult for the student to understand because of the influence of the activated Same A – Same B intuitive rule. In this case, same positive position, same positive velocity.