|
Asia-Pacific Forum
on Science Learning and Teaching, Volume 11, Issue 2, Article 8 (Dec., 2010) |
Student difficulties in reading and creating graphs
Despite their importance, research shows that students show a significant lack of skills required to deal with inscriptions of all sorts. For instance, it was found that students have difficulties even in interpreting inscription that are naturally visual displays, such as science textbooks pictures (Stylianidou, 2002). It is not surprising, therefore, that students were found to show lack of skills required to deal with more abstract inscriptions such as graphs. To understand why handling graphs is challenging for students one should bear in mind that while inscriptions represent the real world they still also entail a separation from it. Reading and creating graphs require students to form abstractions of the real world. This involves individuals perceiving mathematical entities as separate of the object to which they relate (Hershkowitz et al., 2001). In kinematics, the focus topic of this research, abstraction is a must. The following example taken from Foster (2004) illustrates this point. With distance travelled by a moving car, the distance values are considered separately to the car and might be linked to time, that is, be casted as a function of time d=f(t). According to the author, based on Sfard (1991), abstraction continues when the function is recognized as an entity that can be operated on; for example, the gradients of the graph of the distance-time function might be calculated to yield the new entity ‘velocity as a function of time.’ In other words, while on the one hand, position, velocity and acceleration versus time graphs represents the object’s movement, they are just mathematical representations separated from the physical object. For scientists such abstractions are routine, for students and even university students, such abstractions pose a significant challenge. This means that it is hard for students to connect the real world and the graphs which are abstract representation of that same world.
McDermott et al. (1987) identified 2 categories, each divided into 5 subcategories, of student difficulties related to kinematic graphs: (I) Difficulty in connecting graphs to physical concepts: a) Discriminating between slope and height, b) Interpreting changes in height and changes in slope, c) Relating one graph to another, d) Matching narrative information to the graph, and e) Interpreting the area under a graph. (II) Difficulties in connecting graphs to the real world: a) Representing continuous motion by a continuous line, b) Separating the shape of a graph from the path of the motion, c) Representing a negative velocity on a v vs. t graph, d) Representing constant acceleration on an a vs. t graph, and e) Distinguishing different types of motion graphs. Based on McDermott et al. (1987) and other studies, Beichner (1994) developed the Test for Understanding Graphs in Kinematics (TUG-K) and also showed that students had difficulties in understanding graphs.
Student difficulties to read graphs in physics still attract the attention of science education researchers. For instance, Foster (2004) explored the interpretation and construction processes called upon in questions with a graphical component in Western Australian Physics Tertiary Entrance Examinations. The author identified numerous difficulties students had with graphing questions in physics such as students’ non-familiarity with phenomena and physics principles and definitions, considering scales inaccurately, and confusing with slope/height and interval/point. Eshach (in submission) goes one step further and argues that we should not only look at specific difficulties in students' abilities to read and create graphs but also construct a theoretical framework within which such difficulties could be explained. The author suggests that the Intuitive Rules theory of Stavy and Tirosh (1996, 2000) is a theoretical framework that can explain some of the students' difficulties in reading and creating kinematic graphs.
Since video analysis might enable teachers to address difficulties stemming from the activation of intuitive rules, as I will explain below, I will briefly describe the theory and its relevance to explaining students' difficulties. According to the intuitive rules theory, individuals, as a result of their daily experience, develop for themselves a small number of intuitive rules which influence their solutions to a wide variety of conceptually non-related mathematical and scientific tasks that share some common, salient, external features. Eshach (in submission) describes how the following two intuitive rules: ‘Same amount of A–same amount of B (Same A–same B, for short) and More amount of A, more amount of B (More A More B, for short) can account for student difficulties to read and create kinematic graphs. The rule More A-More B indicates that in cases where two objects (or two systems) are presented to students in which one object (or system) differs in a certain, salient quantity A (A1 >A2) and the students are then asked to compare the two objects (or systems) with respect to another quantity B (B1 =B2 or B1 <B2), they might respond inadequately deciding that the quantity B1 is also greater than B2, due to the activation of the intuitive rule ‘More of A–more of B’. In the same manner, when A1 =A2 students often claim that B1 =B2. This, according to Stavy and Tirosh (1999), is due to activation of ‘Same A–Same B' intuitive rule. Stavy and Tirosh as well as other researchers, have provided a variety of examples in mathematics and in science where the application of this intuitive rule by students has resulted in erroneous conclusions. According to Eshach (ibid), the activation of the Same A-Same B rule, which also occurs when students are involved in graph tasks, is expressed in the following ways: 1) interpreting the graph as being a kind of a “picture” which represents the object’s physical path. In that case, instead of interpreting the graph as a representation of some physics entity, they interpret it as being the physical shape of the object’s trajectory itself [Same (trajectory shape) – Same (graph shape)]. 2) Associating the shape of a given graph with the shape of other entities’ graphs [Same (entity's a graph)-Same (entity's b graph)]. 3) Applying the rule upon only some characteristics. For instance, if the original graph has only positive values (say the position-time graph) then the other entity’s graph (say, the velocity-time graph) is perceived as also consisting of positive values only, as well. 4) Same A – Same B, But. In this case, students know that they need to do some manipulation on the original graph they receive. However, the Same A-Same B rule leads the student to heavily depend on the original graph. In other words, the original graph is used as an anchor for the new graph they need to extract and create from it. This leads them to create graphs that are same, but, for instance, inversed.
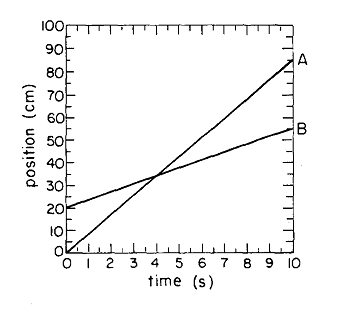
In the same manner, the use of the More A- More B intuitive rule can also impact students' reading and creating kinematic graphs. One example taken from McDermott et al. (1987) that Eshach (in submission) describes to illustrate the use of this rule is the case when a graph of distance vs. time of two objects that are both moving along the same meter stick in constant velocities. At t=0, the slower object has already some distance as shown in graph 1.
Graph 1: position vs. time of two objects The graph distance-time of the two objects will show two crossing lines. According to the author many students, due to the activation of More A-More B intuitive rule, analyze the movement according to the height of the graphs instead of their slopes. This means that the students might incorrectly think that the slower object moves at higher speed in the beginning because its graph is higher. In the crossing point itself many students think that the two objects have the same velocity since their position-time graphs at this point has the same height. This means that students’ thinking in such cases is influenced by the use of the two intuitive rules Same A – Same B, and More A – More B.
To summarize, in this section I described some difficulties that students have in interpreting kinematic graphs. I then used the intuitive rule theory and argued that it provides explanations to a significant part of the students' difficulties. Bowen et al. (1999) posed a challenge to identify features that learning environments need to have so that students’ competencies in inscriptional practices will develop. In a sense, this article is also a response to Bowen et al.'s (1999) call. In what follows I will concentrate on the video analysis technique. I will describe its special features and explain why it is efficient in promoting students reading and creating of kinematic graphs as well as overcoming the above students' difficulties.