The
Study
This
study is to obtain the views of both the students and a senior physics
teacher from a technical secondary school on the applications of data-logging
in three physics experiments. For ease of reference, video clips of the
three experiments are given in Table 1 below.
Table
1: The three physics experiments and their descriptions with some multimedia
materials
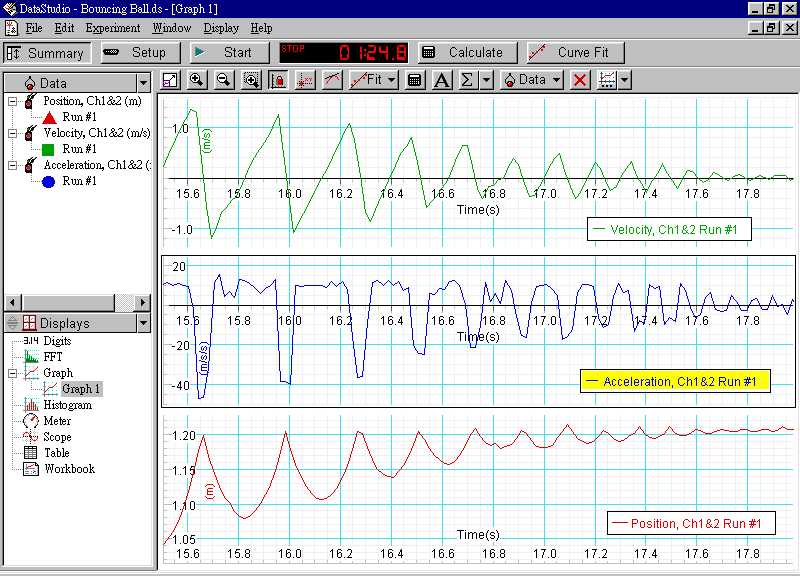
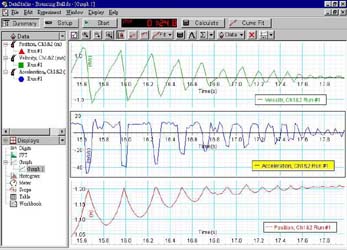
Experiment : Bouncing ball
Objective : To
study the motion of a bouncing ball
Multimedia materials on the experiment:
Experimental Setup
 |
Typical Result
 |
Experimental Procedures: video clip (Bouncing.mov;
file size: 7.64MB and Bouncing.avi;
file size: 5.04MB)
|
|
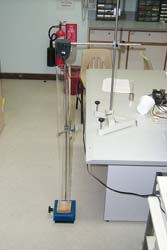
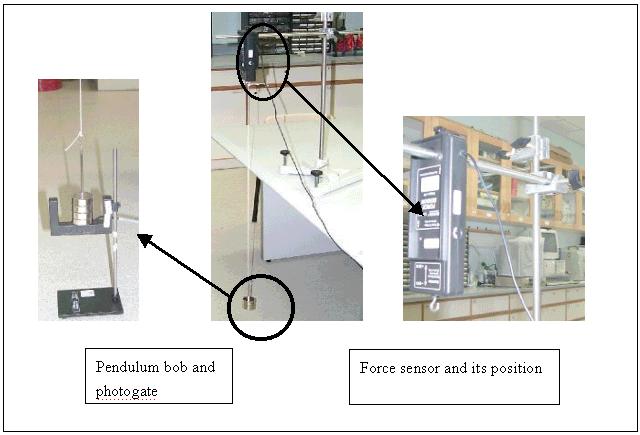
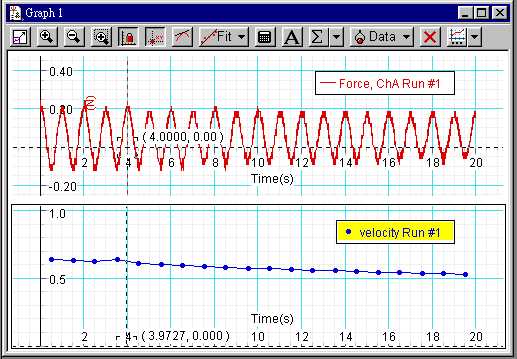
Experiment : Centripetal force of
a pendulum at its lowest position
Objective : To
study the centripetal force on the motion of a simple pendulum system.
Multimedia materials on the experiment:
Experimental Setup
 |
Typical Result
 |
Experimental Procedures: video clip (Centripetal.avi;
file size: 1,879kB)
|
|
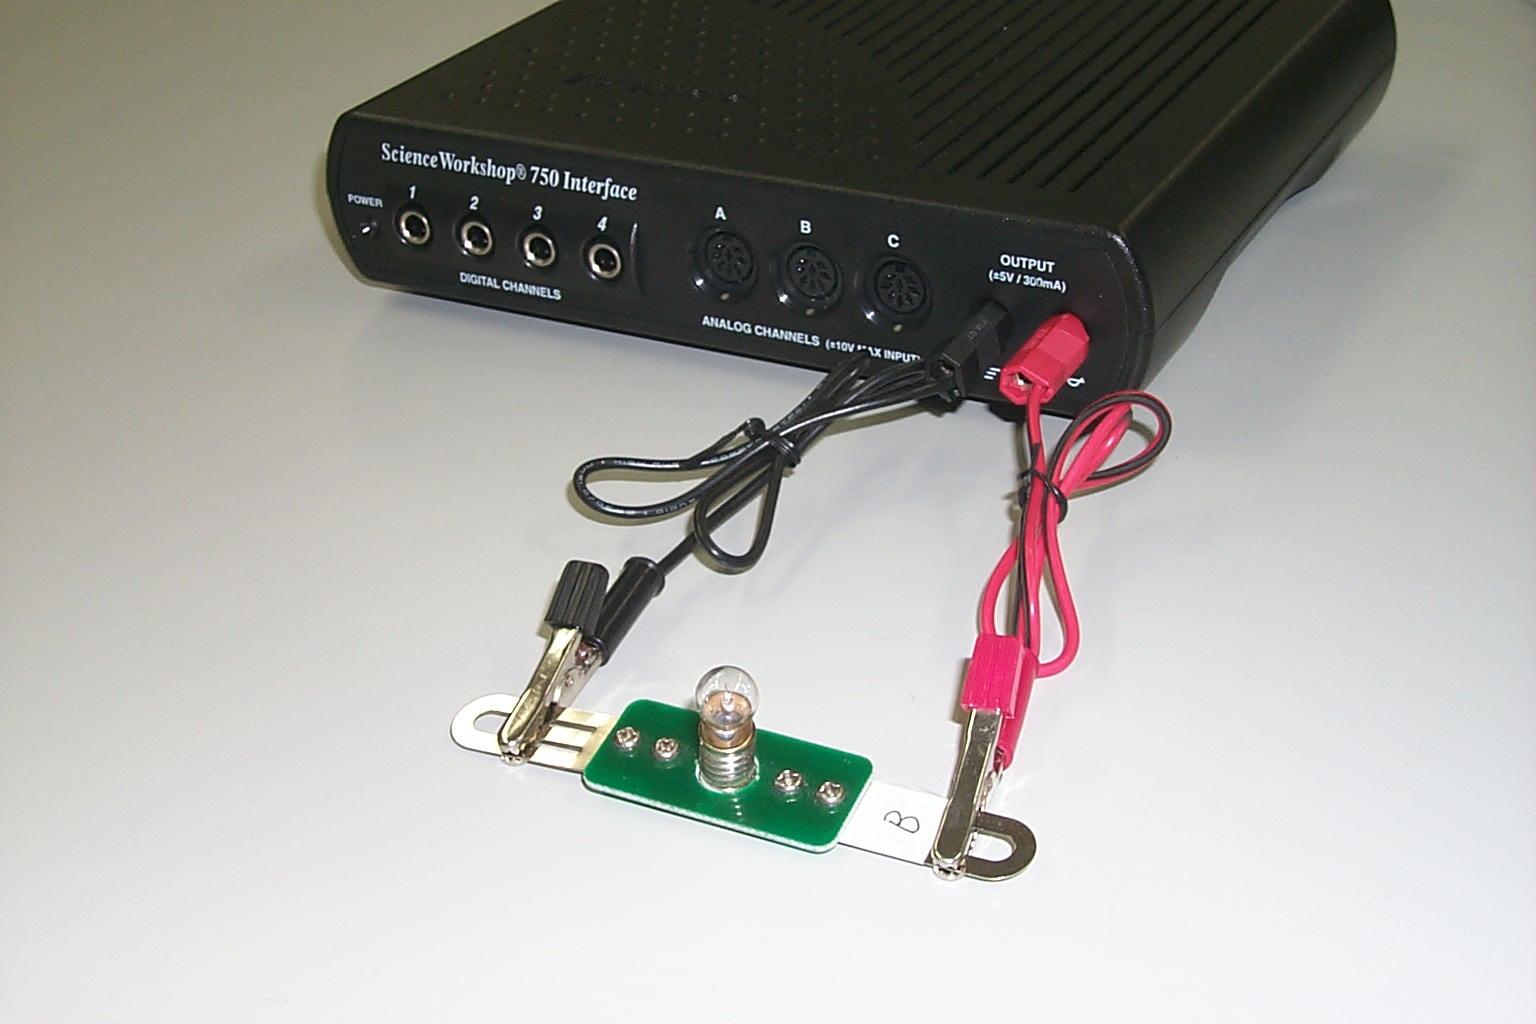
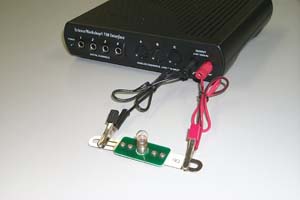
Experiment :Resistance of a light-bulb
filament
Objective :To
explore the resistance properties of a light-bulb filament.
Multimedia materials on the experiment:
Experimental Setup
 |
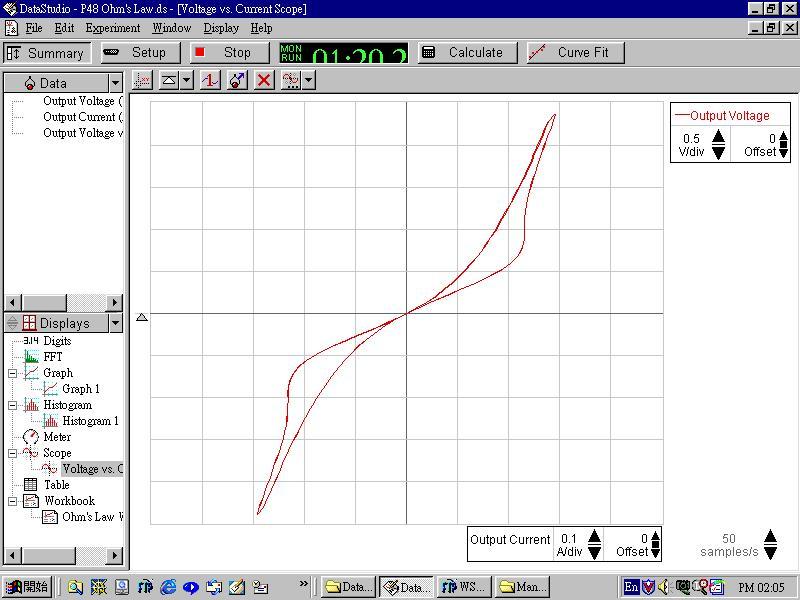
Typical Result
 |
Experimental Procedures: video clip (Resistance.avi
of size 7.52MB and Resistance.exe
of size 899kB)
|
|
The
teacher has 18 years of experience in teaching physics. He is actively
involved in designing student activities, and because of this, he is partly
seconded to the Education Department. The students are 2 classes of S.7
students. They have more than one year experience in doing conventional
A.L. physics experiments. The frequency is at least once every 6 school
days cycle and the duration is normally two hours (3 consecutive periods).
Each
of the trial experiments had two sets of apparatus and lasted for less
than 1 hour. Each class was divided into 6 groups with each group has 3
to 4 students. They did the experiment in a station order. After the first
experiment, they were asked to fill a questionnaire to do a preliminary
evaluation on data-logging. Two weeks later, they finished the other two
experiments and an interview was conducted to obtain further comments.
To
avoid drastic change in the style of the experiment, the three experiments
also start with verifications of some physical phenomena as the conventional
method does. Investigative activities stressing at hypothesis testing and
problem solving are introduced at the second half of the experiments. The
Table 2 below summarizes the details of the experiments.
Table
2: Physical phenomena for verification and further investigation in
the experimental activities
|
|
|
| Physical phenomena verified |
|
|
|
|
| View a bouncing ball from the top with a motion sensor. |
|
| Showing the interrelationships among displacement, velocity, acceleration
and time. Estimation of an average value for g. |
|
| To design experiment to verify a cause of energy loss after each collision
with the floor. |
|
| Centripetal force of a pendulum at its lowest position |
|
| Measure the centripetal force F by a force sensor and the speed v by
a light-gate as the pendulum passes its lowest position. |
|
| Comparing the values of F and mv2/r where m and r are the
mass and the length of the pendulum respectively. |
|
| To suggest the possible sources of deviation between F and mv2/r,
and to alter the set-up to test one of their hypothesis. |
|
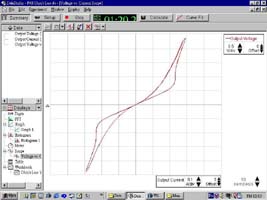
| Resistance of a light-bulb filament |
|
| Apply a low frequency signal to the light bulb and measure its voltage
and current by the corresponding sensors. |
|
| The variation of resistance of the filament with current (temperature). |
|
| To explain the occurrence of a loop in V-I plot and to alter the set-up
to verify the validity of their explanation. |
|
For
example, the details of the laboratory worksheet for usual verification
of physical phenomena and for further investigation in the "Bouncing ball"
experiment are reproduced as follows:
5.4 Choose one segment of motion between two collisions with the floor.
Calculate the kinetic energies after the first collision and before the
second collision respectively. Calculate the maximum potential energy in
that segment of motion as well. Compare their values and explain the differences. |
K.E. just after the first
collision T1 |
K.E. just before the second
collision T2 |
Ratio of the two K.E.
T2/T1 |
Max. P.E. |
| |
|
|
|
Comparison and explanation:
|
|
5.5 There are a few factors that will affect the ratio of the two kinetic
energies in 5.4 above. For one of these factors, try to investigate it
through an experiment. You should make a qualitative prediction of
your results first and then carry out the quantitative measurement. |
Hypothesis (i.e. the factor and your initial qualitative prediction
of its effect)
Investigation (brief description of how you carry out or modify the
experiment)
Findings (numerical results and check if the hypothesis verified or
not)
|
|
|