|
Asia-Pacific Forum on Science Learning and Teaching, Volume 8, Issue 1, Article
2 (June, 2007) Hulya YILMAZ, Hakan TURKMEN, Jon E. PEDERSEN, & Pinar HUYUGUZEL CAVAS Evaluation of pre-service teachers’ images of science teaching in Turkey |
|
Asia-Pacific Forum on Science Learning and Teaching, Volume 8, Issue 1, Article
2 (June, 2007) Hulya YILMAZ, Hakan TURKMEN, Jon E. PEDERSEN, & Pinar HUYUGUZEL CAVAS Evaluation of pre-service teachers’ images of science teaching in Turkey |
It was more difficult to evaluate the nature of the science-learning environment regarding whether it was student-centered or teacher-centered. All of the learning environment elements could be found in 50% percent of drawings. Yet, the element of desks arranged in rows was drawn by only 33% pre-service teachers, which could be categorized as teacher-centered teaching. There was also a strong pattern of "inside" science across these drawings with few of the drawings showing outdoor learning environments, such as observing nature (Table I).
Table I: Environment Frequency
Environment
Desk arrangement
Teacher desk/table
Lab. organization
Symbols of teaching
Symbols of science knowledge
Score
71
110
113
124
112
33
51
53
58
52
In most pictures pre-service teachers drew funnels and metric cups as lab equipment. It would seem that they link these stereotypical pieces of lab equipment with teaching and learning science. In addition, there was little indication of classroom design like a crest-shaped classroom and interesting science formulas written on the chalkboard.
Pre-service teachers’ total mean score on the DASTT-C was 7.47, which falls in the upper range of the middle category—neither student or teacher centered and suggests that a stereotypical view of science teaching has more strongly influenced these future teachers’ expectations of a “science teacher at work” (Figure 1 and 2).
Figure 1: Pre-service Elementary Teachers’ Frequency
Figure 2: Pre-service Elementary Teachers’ DASTT-C Percentage
In the teacher-centered teaching style, representing the 10-13 scores, teachers are leading or directing learning activities. Teachers are introducing a topic of science, preparing students and teaching them how to do an experiment (Figure 3).
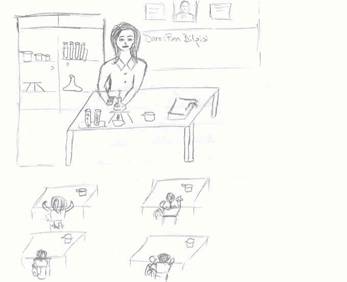
Figure 3: Teacher-Centered DASTT-C Picture and Student’s Explanation
Draw a picture of yourself as a science teacher at work.
What is the teacher doing? What are the students doing?
“Teacher is doing an experiment, which is prepared by herself, in front of the class and giving instruction of how to do the experiment to her students. At the same time, students are firstly watching their teacher and then try to do the experiment.”
In the middle range of scores (5-9), it can be seen that students are doing same experiments with same materials, being led by teachers, or the teacher is encouraging students to ask questions, participate learning process. Students are raising their hands to answer questions and actively doing an experiment assisting by teacher.
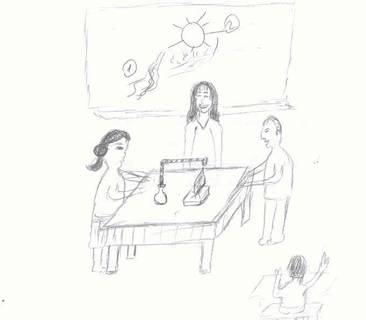
Figure 4: No-decision DASTT-C Picture and Student’s Explanation
Draw a picture of yourself as a science teacher at work.
What is the teacher doing? What are the students doing?
“When the two students are doing experiment, teacher is watching, assisting, asking questions about experiment to them. By the way she is getting other students paying attention to the experiment and guessing how the experiment will go on. The other students are listening, responding to her questions and taking notes.”
Student-centered images (0-4) indicates a constructivist learning environment where students are participating at different tables and/or the teacher is standing with one group of students while other group of students are doing experiment at a different tables.
Figure 5: Student-Centered DASTT-C Picture and Student’s Explanation
Draw a picture of yourself as a science teacher at work.
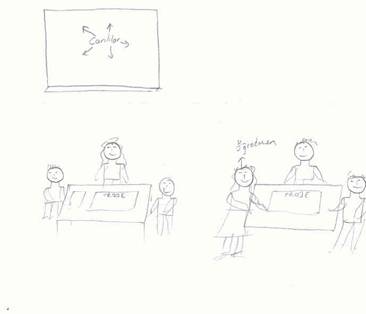
What is the teacher doing? What are the students doing?
“Teacher is standing among the groups of students who are studying science projects and assisting about what the students’ needs. Students can do science projects in class or outdoor learning environment. The students are gathering their data, brainstorming, and trying to make conclusion.
Independent t-test was conducted to evaluate any statistically differences between DASTT-C mean scores of pre-service students with regard to gender. As seen in Table II, there was no statistically difference between male and female students’ DASTT-C mean scores.
Table II: Gender Differences
Gender
N
Mean
SD
df
p
Female
118
7,34
3,248
211
0,44*
Male
95
7,60
3,092
*p<0.05.


Copyright (C) 2007 HKIEd APFSLT. Volume 8, Issue 1, Article 2 (June, 2007). All Rights Reserved.