 |
Asia-Pacific Forum on Science Learning and Teaching, Volume 8, Issue 1, Article
4 (June, 2007) Nwachukwu Prince OLOLUBE The relationship between funding, ICT, selection processes, administration and planning and the standard of science teacher education in Nigeria |
The research design used in this study is summarized in Figure 3 bellow. The first row indicates the independent variables (demographic profiles of respondents). The middle rows show the research hypotheses, sources and data collection technique and data analysis techniques. The bottom row depicts the purpose of the study. The design shows the relationships between construct and perceived usefulness.
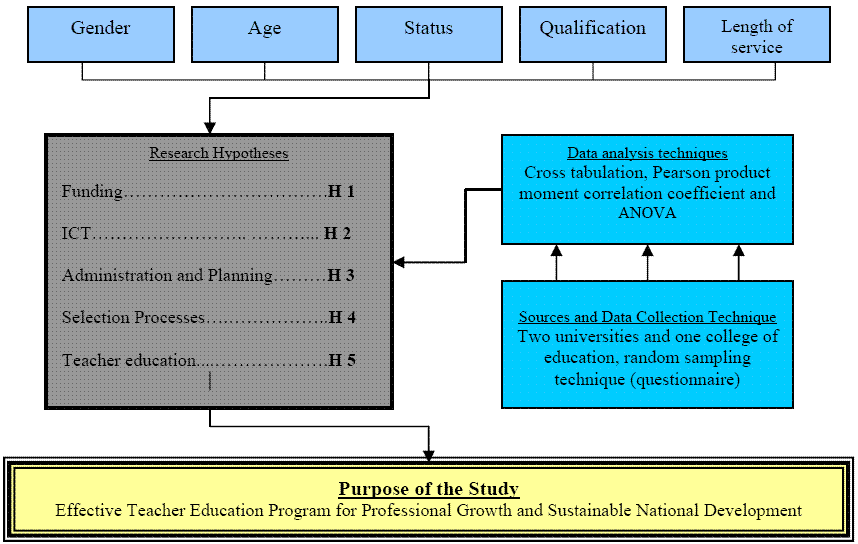
Figure 3. Research Design and Hypotheses Summarized
Research Instruments for Data Collection and Procedures
This empirical study is exploratory in nature. A two-paged structured questionnaire was used to collect data. The questionnaire included two major sections: “A” Personal Information and “B” Teacher education program emphasis scales. Section “A” required the respondents to check the boxes which included their gender, age, status, qualifications and length of service as they applied to them. Section “B”, the core of the questionnaire, required respondents to rate a list of 27 statements including their sub-sections using a 4 point likert scale, where 1 was equal to the lowest and 4 equal to the highest.
The questionnaire’s design was adapted from some questionnaires used by researchers for teacher education program study. The original questionnaires were, however, modified to suit the researcher’s purpose of study. A research assistant who is a graduate of measurement and evaluation was employed to administer the questionnaires to 180 respondents who were accessible in the faculties or school of education in the selected institutions. In total, 154 questionnaires were retrieved. This represented approximately an 86% return rate.
In this study, respondents were classified into two groups: academic (N=62) and non-academic (N=92) staff of three institutions that offer teacher education programs (two universities and one College of Education). Please see Table 1 for details of respondents’ demographic profile. The respondents that comprised the non-academic staff are senior officers of the selected institutions. In spite of the fact that part of the questionnaire’s design was adapted and modified from some questionnaires used by researchers for teacher education program study, the questionnaire for this study was test-piloted by 9 academic staff, and 2 non-academic but senior staff from an institution not selected for the study that offers a teacher education program. Their comments assisted the researcher in improving the quality of the final instrument administered. The respondents were assured of confidentiality if they were willing to answer the questions.
Table 1: Demographic Profile of Respondents
|
Demographic profile |
Number (N) |
Percent (%) |
|
|
Gender |
Female Male |
64 90 |
41.6 58.4 |
|
Age |
25-40 years 41-Above years |
79 75 |
51.3 48.7 |
|
Status |
Academic Staff Non-academic Staff |
62 92 |
40.3 59.7 |
|
Qualifications |
First Degree Post-graduate Degree |
53 101 |
34.4 65.6 |
|
Length of service |
5-15 years 16-Above years |
81 73 |
52.6 47.4 |
Data Analysis and Consistency of the Study
After the data collection stage, all of the structured items of the questionnaires were keyed into a computer and were analyzed using the Statistical Package for Social Sciences (SPSS) version 13.5 of program on a computer. The core of the questionnaire was analyzed using the Pearson Correlation Coefficient statistical tool to determine the significant relationship between funding, ICT, administration and planning, student selection processes and the standard of the teacher education program in Nigeria. One-way-analysis of variance ANOVA was employed to test the relationships between variables and respondents’ demographic profile (gender, age, status, qualifications and length of service). The statistical significance was set at p < 0.05. Importantly, an overall reliability alpha estimate of 0.951 was obtained. Thus the instrument was considered to be very reliable.
Table 2: Pearson Correlation Coefficient of Respondents’ Answers
|
|
Funding |
ICT |
Admin. And Planning |
Selection Processes |
Teacher Education |
|
|
Funding |
Pearson Correlation |
1 |
.869(**) |
.542(**) |
.900(**) |
.677(**) |
|
|
Sig. (2-tailed) |
|
.000 |
.000 |
.000 |
.001 |
|
|
N |
154 |
154 |
154 |
154 |
154 |
|
ICT |
Pearson Correlation |
.869(**) |
1 |
.527(**) |
.887(**) |
.511(**) |
|
|
Sig. (2-tailed) |
.000 |
|
.000 |
.000 |
.000 |
|
|
N |
154 |
154 |
154 |
154 |
154 |
|
Admin. And Planning |
Pearson Correlation |
.542(**) |
.527(**) |
1 |
.643(**) |
.175(*) |
|
|
Sig. (2-tailed) |
.000 |
.000 |
|
.000 |
.030 |
|
|
N |
154 |
154 |
154 |
154 |
154 |
|
Selection |
Pearson Correlation |
.900(**) |
.887(**) |
.643(**) |
1 |
.480(**) |
|
|
Sig. (2-tailed) |
.000 |
.000 |
.000 |
|
.000 |
|
|
N |
154 |
154 |
154 |
154 |
154 |
|
Teacher Education |
Pearson Correlation |
.677(**) |
.511(**) |
.175(*) |
.480(**) |
1 |
|
|
Sig. (2-tailed) |
.001 |
.000 |
.030 |
.000 |
|
|
|
N |
154 |
154 |
154 |
154 |
154 |
** Correlation is significant at the 0.01 level (2-tailed).
* Correlation is significant at the 0.05 level (2-tailed).
Hypothesis 1: There is no significant relationship between the nature of funding and the standard of teacher education programs in Nigeria.
The correlation statistics reported that the nature of poor funding in institutions with teacher education programs is significantly related to the poor standard of education in Nigeria. Lawal (c.f., 2003) noted that inadequate finance from both the federal and state governments militates against the progress of colleges of education and teacher education programs generally. Also, the impact of corruption is pervasive both in terms of the drain on national resources and its corrosive influence on institutional efficiency and service delivery in all sectors including teacher education (c.f., Samuel, 2006). This signals the remoteness of professionalism. A Pearson’s (r) correlation value r = 0.677, p < 0.001 was obtained. Therefore, this result does not support the hypothesis. Thus, the hypothesis was rejected.
Hypothesis 2: There is no significant relationship between the ICT usage and the standard of teacher education programs in Nigeria.
The findings from the analysis for ICT integration in teacher education programs in Nigeria and the effectiveness of teachers showed that there is a relationship between the poor provision and uses of ICT instructional materials during pre-service teacher training and their performances after graduation. Consequently, a correlation value of r = 0.511, p < 0.000 was achieved. The implication is that respondents were dissatisfied with the level of integration of ICT into teacher education programs. Therefore, this hypothesis is not true, and thus was rejected. This is so because the slow access to basic ICT equipment, low internet connectivity and computers, and the inadequacies in the use of audiovisual materials and equipment in teacher education programs are barriers to the effective and professional development of teachers in Nigeria (c.f., Ololube, 2006a).
Hypothesis 3: There is no significant relationship between the administration and planning processes and the standard of teacher education programs in Nigeria.
The result for hypothesis 3 demonstrated that the poor administrative and planning processes have a significant relationship to the poor standard of teacher education programs in Nigeria. A Pearson correlation value of r = 0.175, p < 0.030 was obtained which suggests that respondents found that the administration and planning processes in Nigerian teacher education programs is inadequate for the growing need to improve teacher preparation processes. The low correlation coefficient was likely as the respondents supposed to show slightly different correlation dimension on the effect of administration and planning processes on the standard of teacher education in Nigeria. However, the correlation is significant at p < 0.05 level (2-tailed).
Hypothesis 4: There is no significant relationship between the pre-service teacher selection processes and the standard of teacher education programs in Nigeria.
Hypothesis four posited that a significant relationship exists between the poor standard of teacher education in Nigeria and the pre-service teacher selection processes. Consequently, this was shown in the correlation value of r = 0.480, at p < 0.000 significant level. That is, this hypothesis is true and was accepted. It was found equally true in Lawal (c.f., 2003) and Ololube’s (c.f., 2004) findings that the selection of candidates into various teacher education programs was based upon arbitrary and uneven requirements that vary from state to state and college to college. The poorest students in terms of academic achievements seem to be most suitable for absorption into the teaching profession. Hence the poor standard of teacher education in Nigeria.
Hypothesis 5: There is no significant relationship between the standard of teacher education programs in Nigeria and the nature of funding, ICT usage, the administration and planning processes and pre-service teachers’ selection processes.
The analysis of hypothesis five showed that the poor standard of teacher education programs in Nigeria is significantly related to the nature of funding, ICT usage, administration and planning processes and pre-service teachers’ selection processes at r = 0.677, p < 0.001; r = 0.511, p < 0.000; r = 0.175, p < 0.030 and r = 0.480, at p < 0.000 respectively. The results revealed that there was a significant relationship between the variables and the standard of teacher preparation in Nigeria. Thus the hypothesis was rejected
There were no significant differences in the overall ANOVA analysis based on the respondents’ demographic variables. Gender showed F = .429; and p > .560. The results of the analysis of variance for age indicated no significant differences on the variables tested. The values of F were: F = .451; p > .577. For status, F = .552; p > .459. Whereas based on respondents’ qualification F = .276 and p > .688, for length of service F = .485 with p > .571. See table 2 for details.
Table 3: Analysis of Variance of the Relationships between Variables and Respondents’ Demographic Profile
Demographic profile |
Groups |
Freq. |
(%) |
Mean |
SD |
F Ratio |
F Probability Sig. |
Gender |
Female Male |
64 90 |
41.6 58.4 |
3.13 3.07 |
.86 .87 |
.429 |
.560 |
Age |
25-40 years 41-Above years |
79 75 |
51.3 48.7 |
3.02 2.89 |
.86 .88 |
.451 |
.577 |
Status |
Academic Staff Non-academic Staff |
62 92 |
40.3 59.7 |
2.98 3.00 |
.83 .85 |
.552 |
.459 |
Qualification |
First Degree Post-graduate Degree |
53 101 |
34.4 65.6 |
2.78 2.89 |
.84 .87 |
.276 |
.688 |
Length of service |
5-15 years 16-Above years |
81 73 |
52.6 47.4 |
2.57 2.45 |
1.02 .89 |
.485 |
.571 |
![]()
![]()
![]()