Asia-Pacific Forum on Science
Learning and Teaching, Volume 5, Issue 2, Article 5 (Aug., 2004)
Isaac Pak Hoi TSE, Winston Kwok Kuen LEUNG and Shing Yi CHAN
Science, Technology and Society - An authentic exploration on IR
thermometers application in schools
During the SARS crisis
in 2003, we joined the onrushing crowd purchasing a few sets of infrared
thermometer for measurement of students' body temperature before they enter
the school. It was thought that such "hi-tech" device could provide us fast
and convenient way of screening students from those having fever, a symptom
of SARS. However, after a fairly long period of practice, it was found that
readings on display of such devices varied in a range wide enough to make us
unsure whether a student is having fever or not. Despite the calibration,
the IR non-contact devices seemed not offering out consistent readings about
a person's forehead temperature, sometimes ranging from 27°C to 33°C, which
was so confusing. Therefore we decided to take a deep look into the matter
to see what was happening. Below are our findings that we'd like to share
with all those encountering similar situations.
Our Sequence of investigation
At
first, we suspected that the device was not well calibrated or
mal-functioning. Hence we shipped them back to the factory requesting a
thorough check as well as certified calibrations. We were confirmed that the
devices were functioning as designed and calibrated as specified.
Mal-functioning is not a reason to the fluctuations of readings. We could
reject malfunctioning as a reason if we could prove that temperature
displayed on the IR thermometer followed a straight line with rise and fall
in temperature range between 22 to 55 degree Celcius. The same applied to
our Data-Logger. Then we could countercheck temperature readings
reciprocally using both devices. Hence we started our explorations for the
whys and wherefores.
First
of all, adopting the temperature sensors of the Data-Logger set, we decided
to repeat the calibration on our own. The purpose of doing this is to make
sure the device is accurate to an extent enough
for our aim or, if not, how far it was from behaving as what was
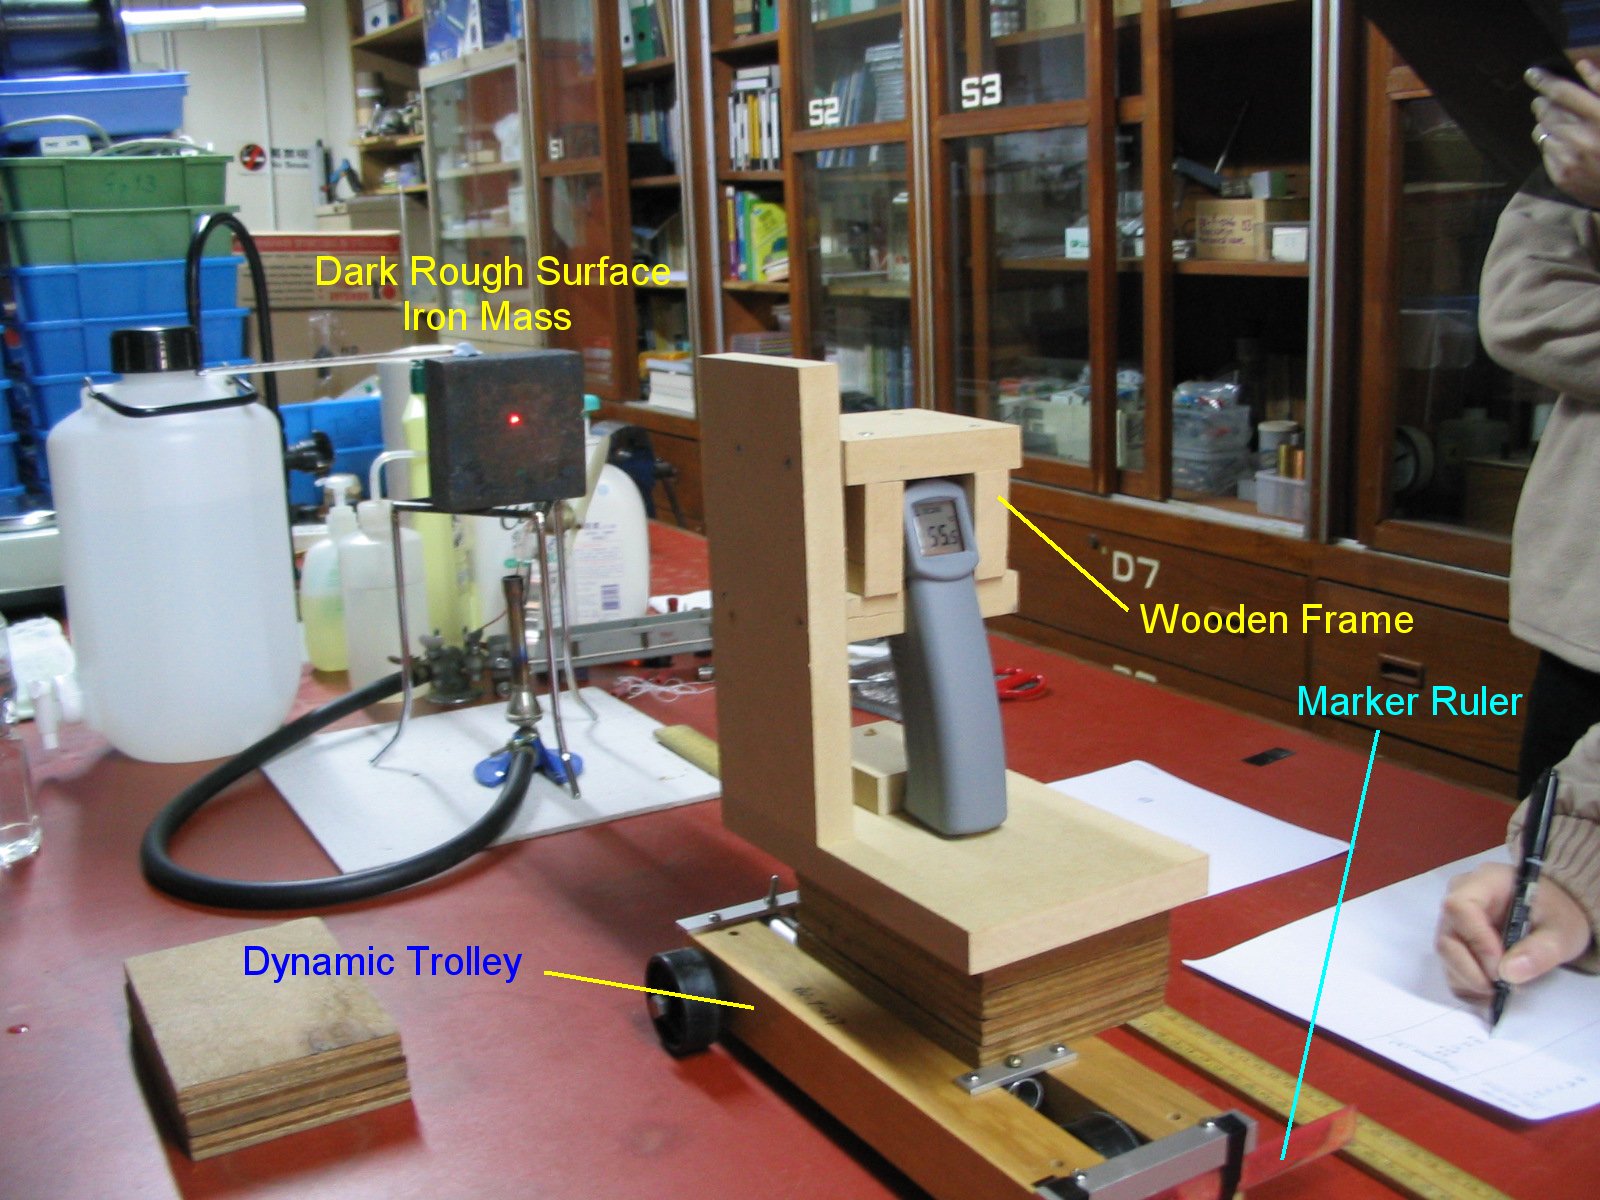
designed to feature. We used a Data-Logger
temperature sensor to countercheck the linear response of the IR
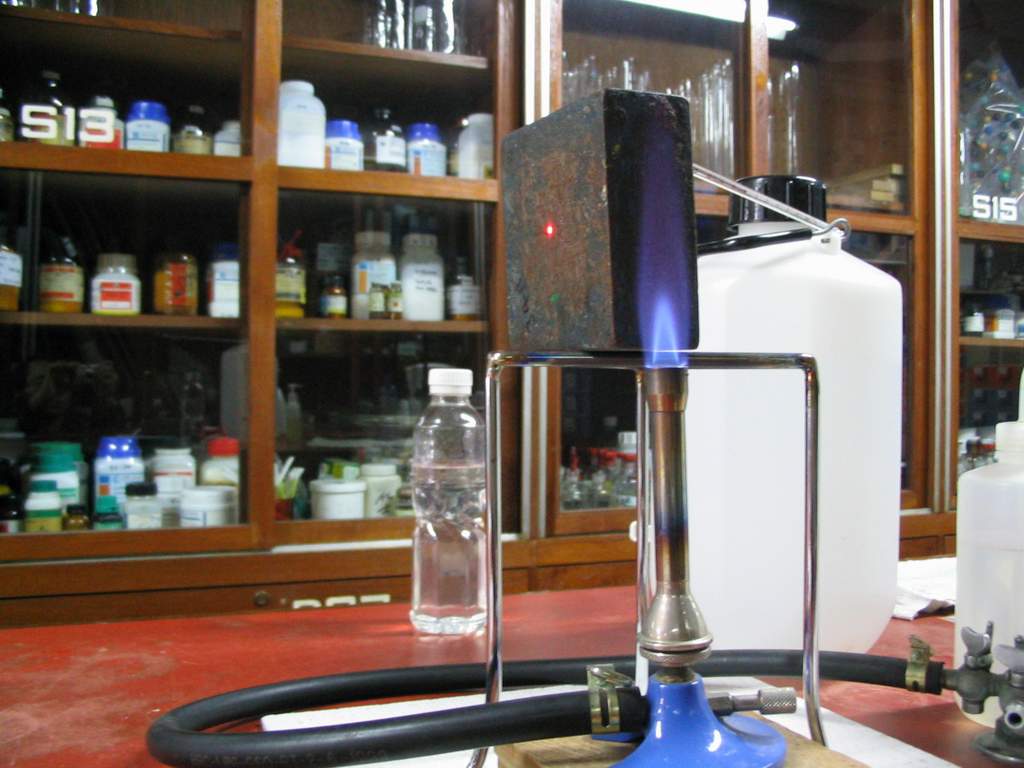
thermometer. To facilitate the calibration process, a wooden
frame was constructed to hold the device under test firm in position and
mounted on a dynamic trolley available in school Physics Laboratory as shown
on the left. Markers were also adhered to the trolley as pointers indicating
distances from the object being measured. The wooden frame was so mounted
that the laser pointer from the device was pointing approximately the middle
region of the object being measured. Since shinny surfaces exhibit low
emmissivity of infrared wave, an iron mass of about 3 Kg with dark and rough
surface was used as the object to be measured. To avoid fast heat loss while
taking readings, such a heavy object was believed to possess adequate heat
capacity.
1. Calibration (Linearity Response
Counterchecked with Data-Logger Sensor)
Holes were drilled on the 3 Kg iron
mass. The first one was drilled in the middle of the top face deep enough to
reach the center of the mass inside for the first sensor to measure the
inner temperature of the object. The second one was drilled just beneath the
front surface for the second sensor to monitor the surface temperature which
should most possibly match with that on the infrared thermometer display as
expected.
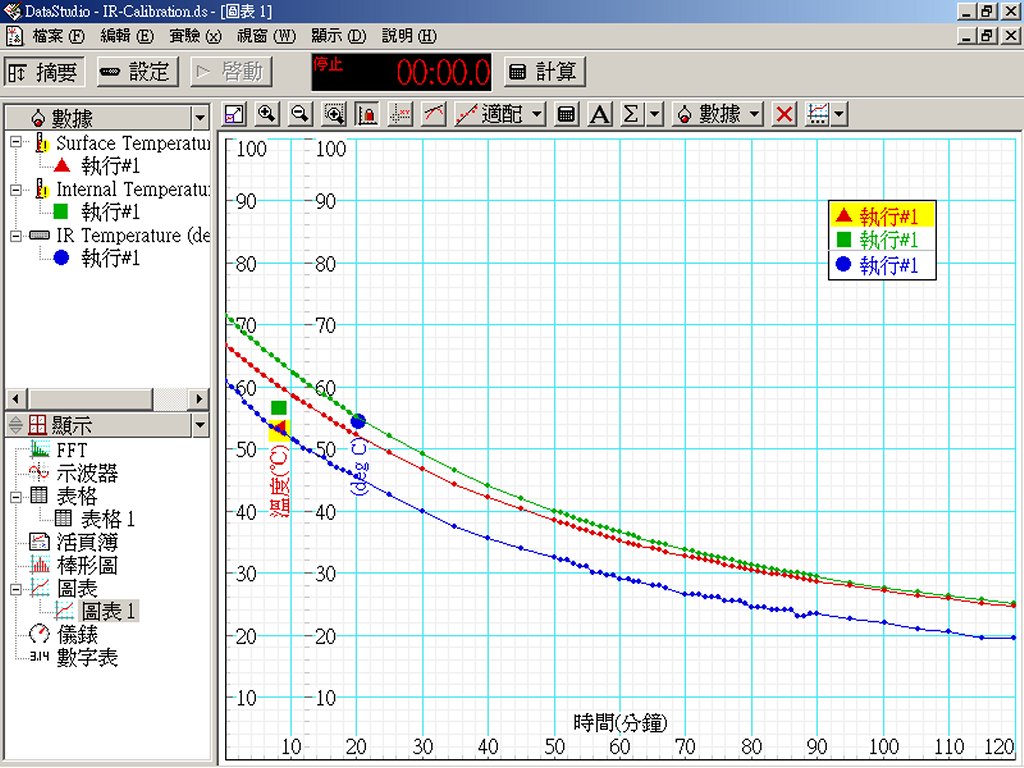
In the first part,
the mass was then heated up with a Bunsen flame to approximately 90°C at
the beginning. It was then allowed to cool down gradually to room
temperature while taking readings both from data logger and infrared
thermometer simultaneously. See Fig. 1 below.
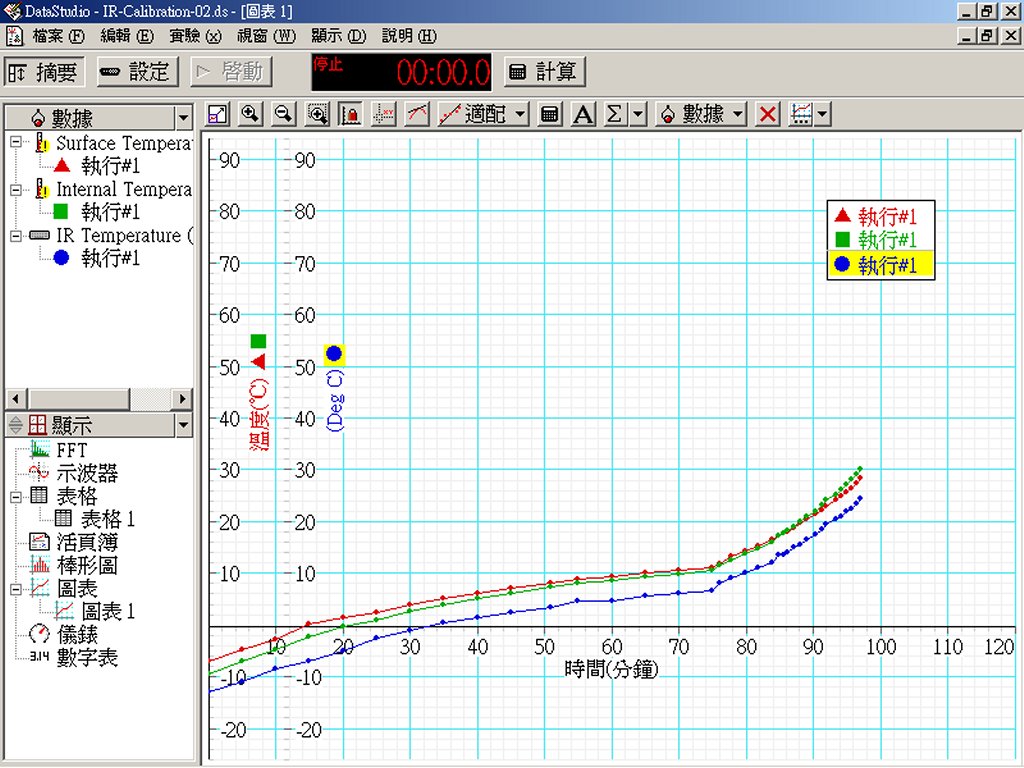
In the
second part, the mass was then placed inside the freezer of a fridge
to cool down to about
-15°C at the beginning. It was then allowed to warm up gradually to room
temperature while taking readings both from Data-Logger and infrared
thermometer simultaneously. See Fig. 2 below.
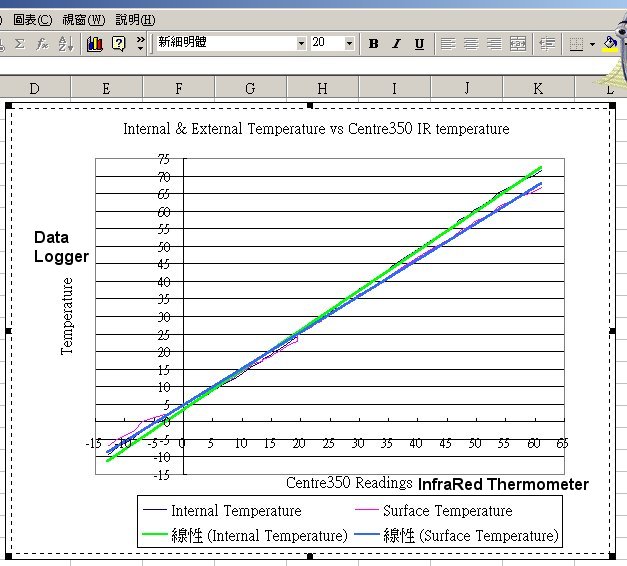
Then 2 curves of the
infrared readings against the inner temperature readings and the surface
temperature readings were plotted respectively as indicated below in Fig. 3.
It can be seen that the 2 curves were very close to straight lines which
implied linearity characteristic of the infrared thermometer. In both Fig. 1
and Fig. 2, the blue line stands for infrared
thermometer reading. The red line stands for
the surface temperature detected by Data Logger. The
green line stands for the inner temperature detected by the second
sensor of Data Logger. Judging from Fig. 1 and Fig. 2 the infrared detector
exhibited a linear responding characteristic as that of the temperature
sensor monitoring the surface of the iron mass except with a constant
difference that seemed to be a calibration problem. Looking from the slopes of the curves in Fig. 3, we found that the
Data-Logger sensor and IR thermometer were both acceptable for the purpose
of our investigations despite exhibiting different linear thermal
properties.
After confirmation
of the response characteristic of the infrared thermometer, we started
exploring
suspected possible causes of the fluctuations.
Suspected reasons of fluctuation include :
(1)
Battery voltage drop after current consumption has reached a certain level
(2) Low quality and/or poor stability of the device
(3) Ambient temperature of the environment where the
device is being used
(4) Skill of the operators holding the device
(5) Specifications requirement of the device not
matched when being used
2. Battery Voltage Drop
Since the device is
powered by 009P type 9V battery with a current capacity of about 400mAH
only, the first and most suspicious reason was voltage drop due to long time
usage. To begin with, we had prepared two pieces of 009P batteries
beforehand, one discharged with a current of about 200mA by a light bulb for
approximately one and a half hour to about 6V and the other one brand new.
Then the infrared thermometer was first fitted with a brand new battery and
mounted on the wooden frame. Pointing at a 3Kg iron mass with dark rough
surface preheated to about 40°C at a distance of about 30cm, the temperature
reading was recorded. Then we changed the new battery with the exhausted
one. Temperature reading was taken again at the same distance. In order to
be sure, the process was repeated 5 times with data recorded as below.
Trial #1
Trial #2
Trial #3
Trial #4
Trial #5
New Battery
39.5°C
39.0°C
38.5°C
38.0°C
39.5°C
Exhausted Battery
39.5°C
40.0°C
39.5°C
39.5°C
39.0°C
From the table above,
it was concluded that battery voltage had no significant influence on the
readings of temperature detected. Therefore, battery voltage drop was NOT a
cause of the fluctuation.
3. Low Quality and/or Poor Stability
Quality and/or
stability of the device could affect the output result quite dramatically.
However, it was not difficult to check this out. The 3Kg iron mass was
preheated to about 40°C and allowed to cool gradually. The infrared
thermometer was then pointed at the center of the iron mass at a distance of
30 cm and reading taken. The process was repeated 5 times at intervals of 15
seconds. Result was recorded as below.
Trial #1
Trial #2
Trial #3
Trial #4
Trial #5
Time
0 second
15 seconds
30 seconds
45 seconds
60 seconds
Temp Reading
38.5°C
38.0°C
38.5°C
38.5°C
38.0°C
From the table above,
it was clearly shown that readings were in consistency after 5 trials within
a minute of time. Therefore, stability of the device was quite satisfactory.
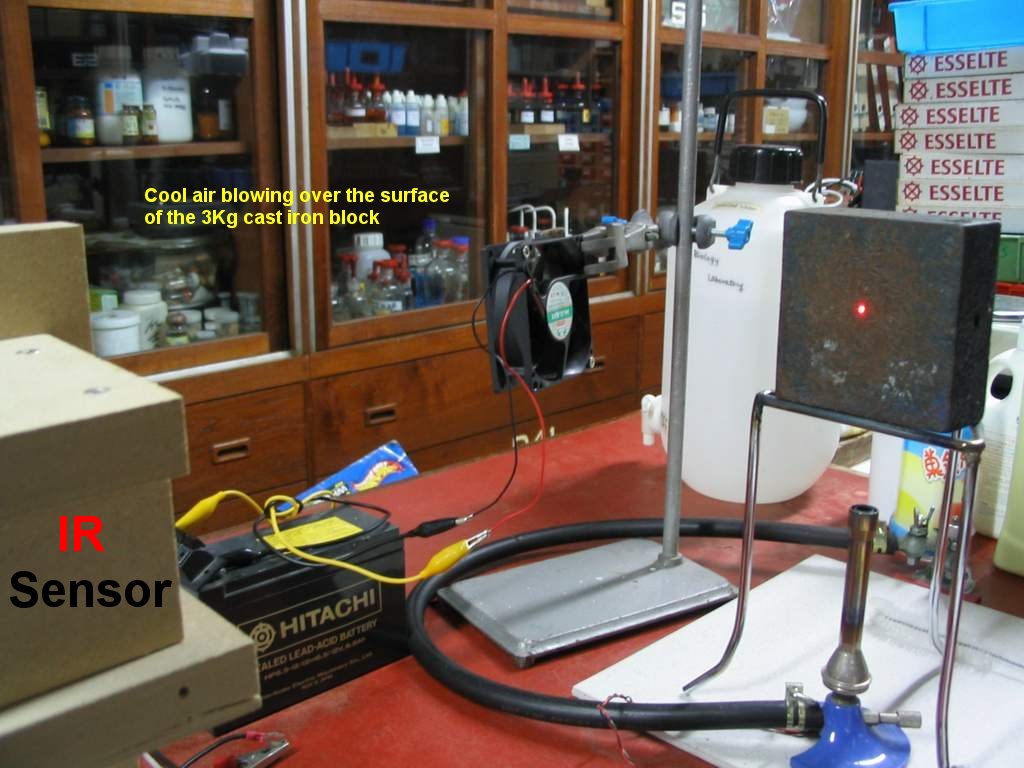
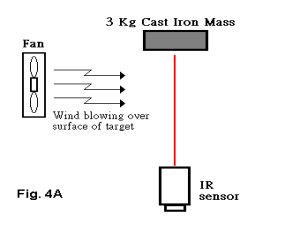
4. Ambient Temperature Test
Another suspicious
cause of inaccuracy or fluctuations was ambient
temperature. Since the environment where we take body temperatures of
students were at the main gate of the school and it was occasionally windy.
Thus, some of our staff suspected that cold air blowing over the forehead
could possibly affect very much the temperature detected. Hence we set up
the experiment below to take a closer look into this.
As consistent
standard, the 3 Kg mass was preheated to about 40°C and allowed to cool
gradually. But this time, we mounted a computer type mini cooling fan in
front of the heated mass as shown such that cool air could be blown over the
surface of the heated mass when necessary. Then readings were taken under 4
conditions as follows :
Situations
Temp
(1)
The infrared thermometer was pointed at the pre-heated mass with the
fan turned OFF
T1
37.5°C
(2)
The infrared thermometer was pointed at the pre-heated mass with fan
turned ON and cool air blown from
left to right
over the surface
T2
37.5°C
(3)
The infrared thermometer was pointed at the pre-heated mass with fan
turned OFF again
T3
37.0°C
(4)
The infrared thermometer was pointed at the pre-heated mass with fan
turned ON and cool air blown from
right to left
over the surface
T4
36.5°C
The time intervals
between each successive reading taken were 30 seconds approximately. It was
noticed that cool air either blowing from left to right or right to left
over the heated surface of the iron mass did not bring much difference to
the infra-red detection reading. The temperature drop of about 1 degree
after 2 minutes is more likely being caused by natural cooling of the mass
itself.
It
became obvious that cool air blowing over the surface of the object being
detected did not cause significant effect in its emission of infrared
energy. Therefore, ambient temperature variation was
NOT a cause of the fluctuation either.
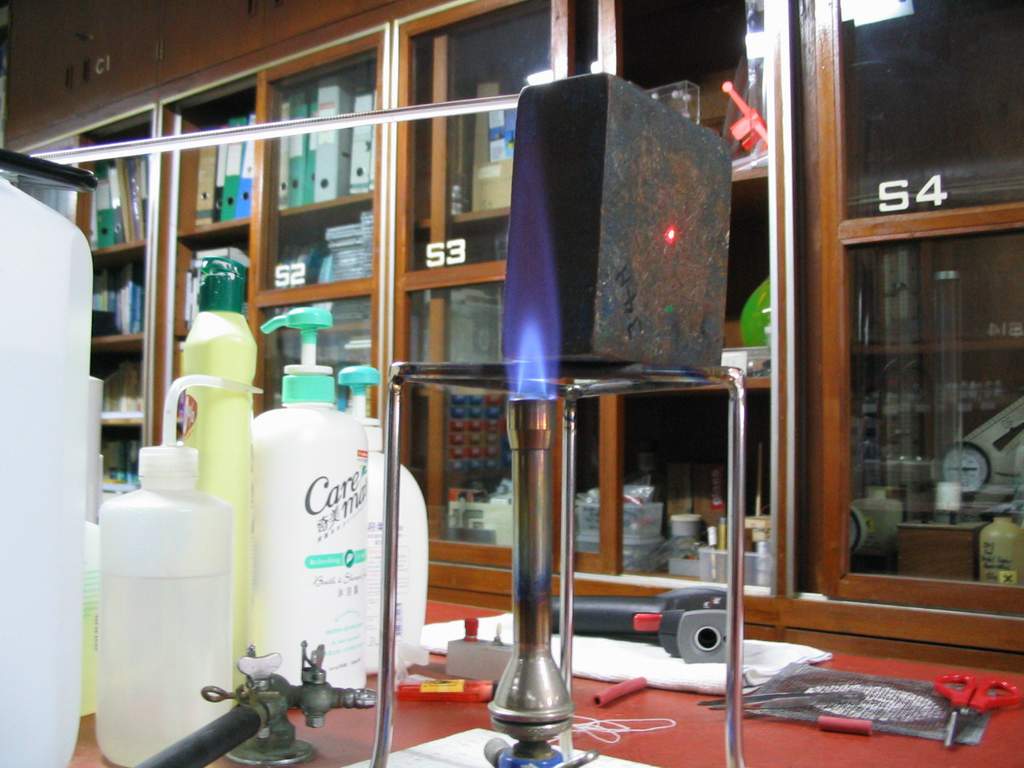
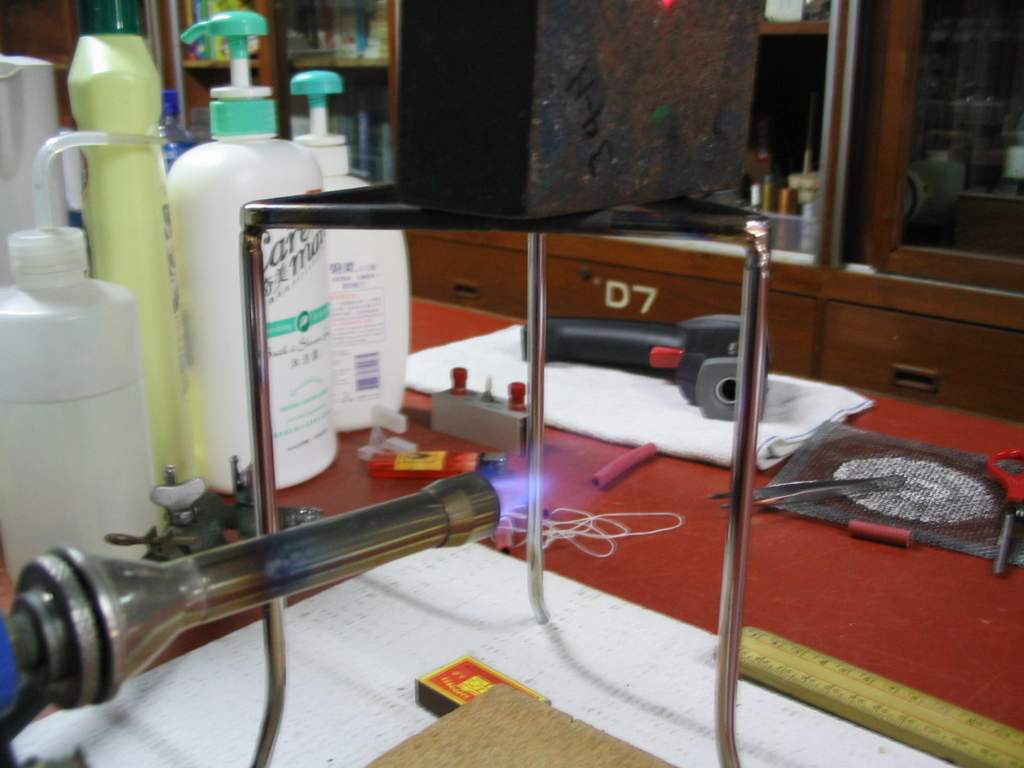
For further confirmation that ambient temperature was not a factor to cause
inaccuracy, a Bunsen flame instead of the computer cooling fan was placed in
three different positions nearby the 3 Kg mass as that indicated below. As
expected, the Bunsen flame did not cause any significant fluctuations in the
IR readings. Temperatures recorded in
these 3 cases were approximately 36°C only.
5. Handgrip and Attitudinal Test
A
series of tests had been used to investigate the fluctuation of the device,
but still could not find out what the main reason was. It was quite
disturbing to us. We began to investigate human factors, to simulate how
users may use the device to measure the body temperatures of students by
considering their attitude
(focused vs. casual) in griping the device. Since
there was a built-in laser pointer on the device, three kinds of aiming
method were tried to see whether there were any new findings or not.
(1) Measurement with assistance of Laser Beam Aiming
(2) Measurement with assistance of Naked Eye Aiming in
concentrated way
(3) Measurement WITHOUT any aiming assistance in
approximate way
This
time, the IR thermometer was held in hand as
usual and measurements were taken from 5 different directions.
Distance from the mass to the device was not fixed during
measurements so as to simulate the actual situations. Results were recorded
as below.
Aiming Assist
A
B
C
D
E
Laser Beam
35.5°C
34.5°C
34.0°C
34.5°C
34.0°C
Naked Eye Aim
35.0°C
31.0°C
33.5°C
32.0°C
28.5°C
Approx. Aim
34.5°C
24.0°C
33.0°C
33.0°C
19.0°C
From the table above, variations of readings were found in
the test. It seemed that we're on the track of discovering something
related. Hence, we carried on to the up-tilt/down-tilt test to see what else further could be found. In this session, the aiming laser
beam was directed from the same origin to 5 different spots (Center,
Upper edge, Lower edge,
Left edge and Right edge)
as indicated below.
Then readings taken under 5 conditions were as follows :
Situations
Temp
(1)
The infrared thermometer was pointed at the
Centre of the pre-heated mass with laser beam
T1
32.0°C
(2)
The infrared thermometer was Up Tilt with the laser beam located just at the upper
edge of the pre-heated mass
T2
34.5°C
(3)
The infrared thermometer was Down Tilt with the laser beam located just at the lower
edge of the pre-heated mass
T3
16.5°C
(4)
The infrared thermometer was pointed at the
Left hand side of the pre-heated mass with the laser beam just
falling outside the mass
T4
30.0°C
(5)
The infrared thermometer was pointed at the
Right hand side of the pre-heated mass with the laser
beam just falling outside the mass
T5
20.5°C
The angle up- or
down-tilt measured was as small as 9° only.
Such a small deviation of angle in holding gesture did really cause a
significant variation in the readout of the device.
From the table above, it was found that holding gestures of the users was
the main reason in causing erratic fluctuations of readings to the device.
We therefore considered that maybe it was the specification requirements of
the device were not matched when being used. After perusal of the operation
manual of the IR thermometer, several points
were noted.
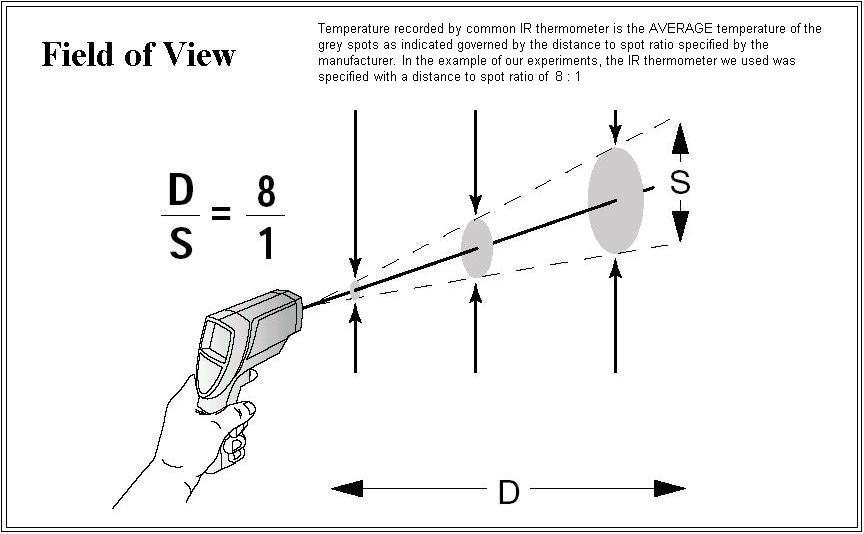
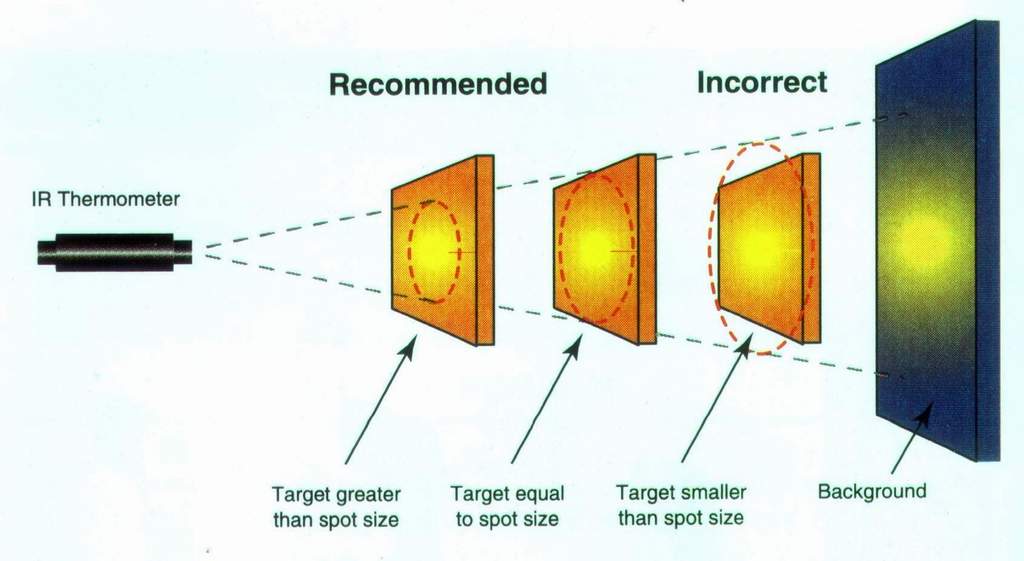
6. Specification Requirement
According
to the operation manual, the device being used should follow the “Distance
to Spot Ratio”
requirement. The detection area must be larger
than the required spot size to get correct readings. See ”Field
of View”
below.
As
the reading shown on display was the AVERAGE
temperature of the detected region, errors can easily occur if the object to
be measured cannot fill up the Field of View of the detection spot. For
example, if the diameter of the spot with consistent body temperature on
human forehead was only about 40mm, the device should thus be placed at
about 320mm away from the detected region all the time.
The device displaying higher values of readings means the more capability of
radiation emittance the materials have. Emissivity
means the energy-emitting characteristics of materials. This was also a
factor of causing inaccuracy.
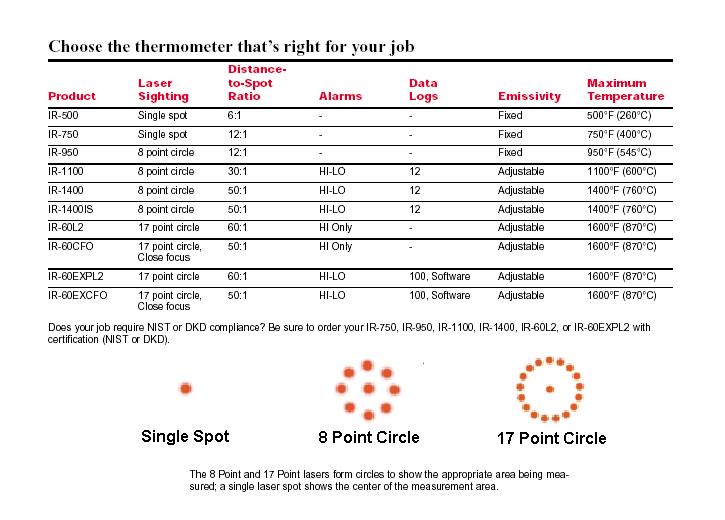
The
information below shows different devices with different characteristics.
Fig. 10 shows the specification of other brand's infra red thermometer.
Laser sighting
e.g. single spot, 8-point circle, 17-point circle with or without focus.
Distance to Spot Ratio e.g. 6:1, 8:1, 12:1, 50:1 etc. Emissivity
can be adjustable or fixed. Maximum temperature they can reach are
different. All these criteria influence the accuracy of the readings we
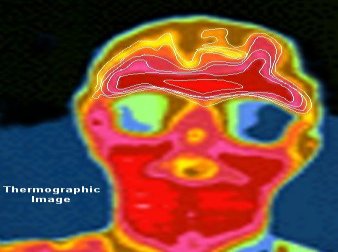
take. Fig. 11 shows the distribution of emissivity of a human body. The
white lines on the human forehead clearly separate the temperatures into
regions. The regions change from time to time according to the blood flow
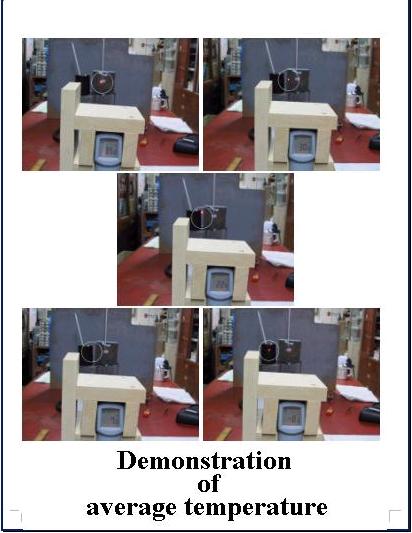
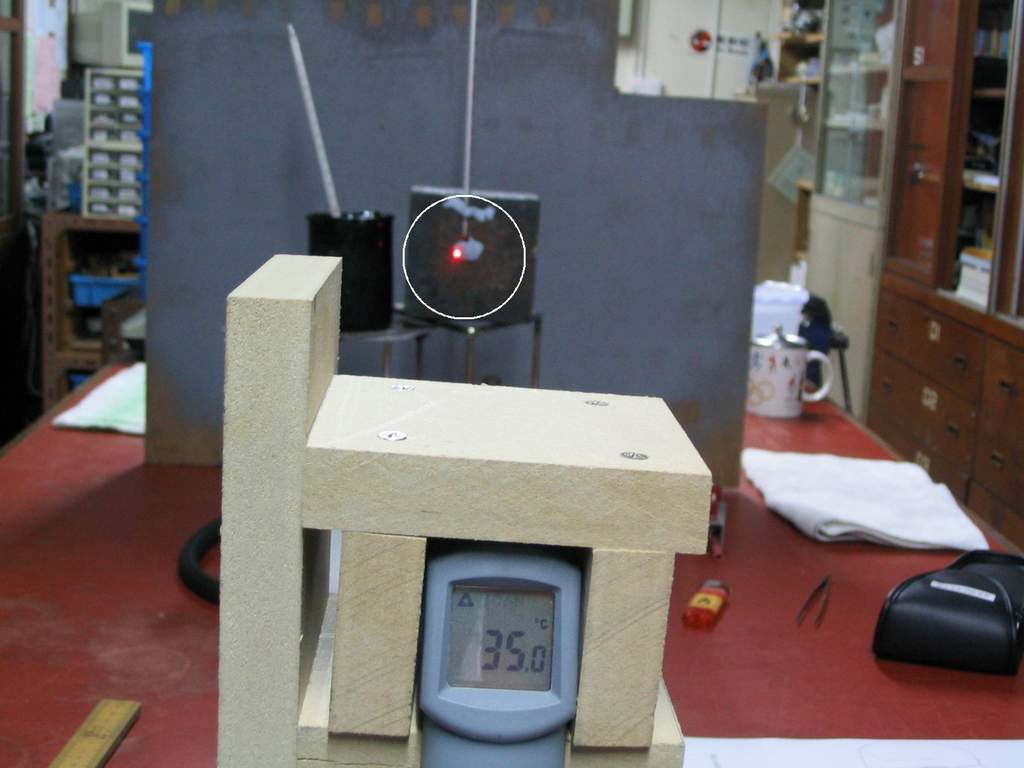
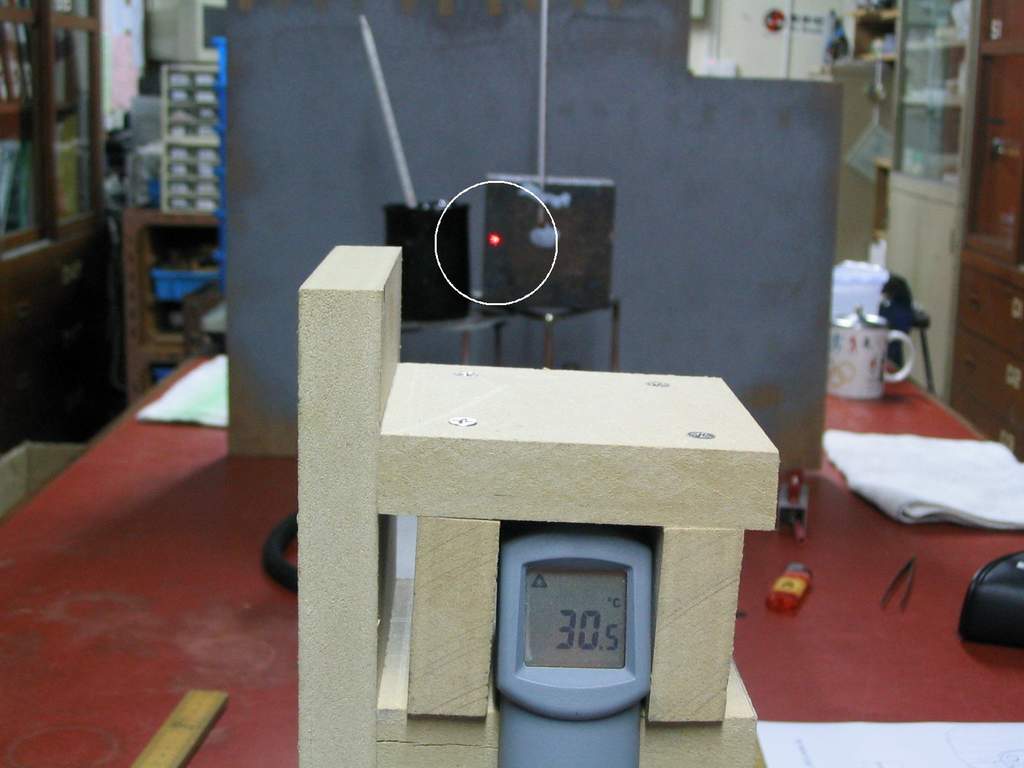
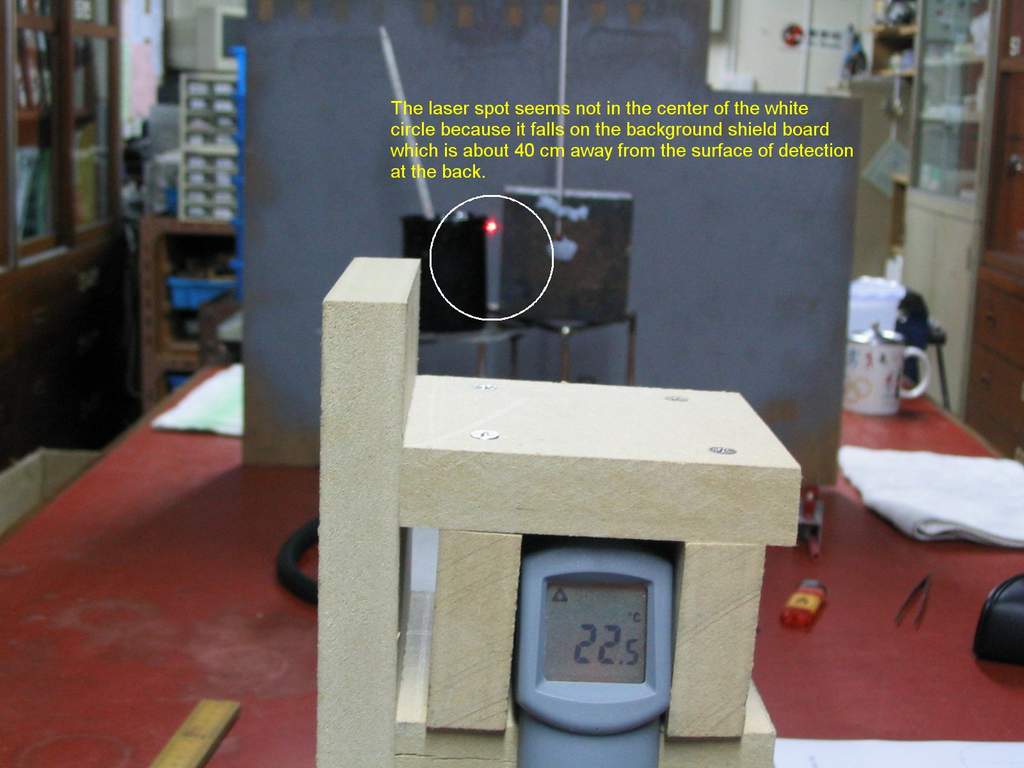
through the human forehead. Fig. 12 is a Demonstration of characteristics of average
temperature taken within a spot. Fig. 12A~12E
shows a clear picture of differences when the spot fall on different areas
of the detected region. The white circle is the detected area formed
according to the distance to spot ratio.
From
the series of pictures 12A to 12E above, we clearly see that if the spot
doesn't fall on and cover up the right region to be measured, erratic
readings are to be expected due to detection of IR
energy from elsewhere other than the region we want.
Since
the acceptable range for deciding whether a person is having fever or not is
only within 1°C to 2°C, and the
requirement of operators to maintain a steady holding gesture is so
difficult in every measurement. Either judging from the up-tilt/down-tilt test or the test in Fig. 12A to 12E, the errors were so huge
that the device is NOT quite a suitable machine either in defining whether a
person is having fever or to screen out students from having fever or not.
Further Challenge, Further Lesson
We thought all the tests were done with infrared thermometer of Brand
A, again we met new challenge. We were told, Brand B (RayTek) must be more
accurate because the readings taken were around 33°C
~ 35°C. a range connected to the known temperature measurement of human forehead; and it is three
times more expensive. Brand A was said to be less accurate because
it gave readings in the range 28°C ~ 30°C,
away from the known range. Sounds reasonable, but now we know we can
be cheated by our own pre-conception. Since we knew that erratic readouts
from
these types of IR thermometers can be so vast,
we learned that judging the accuracy of the instrument simply by quoting
that the readings are near to normal body temperature of human beings
is not scientific at all. Judging the accuracy of the instrument could
be counter-intuitive.
The
next step was to conduct some more tests to see which one will be more
accurate. Here are our results below.
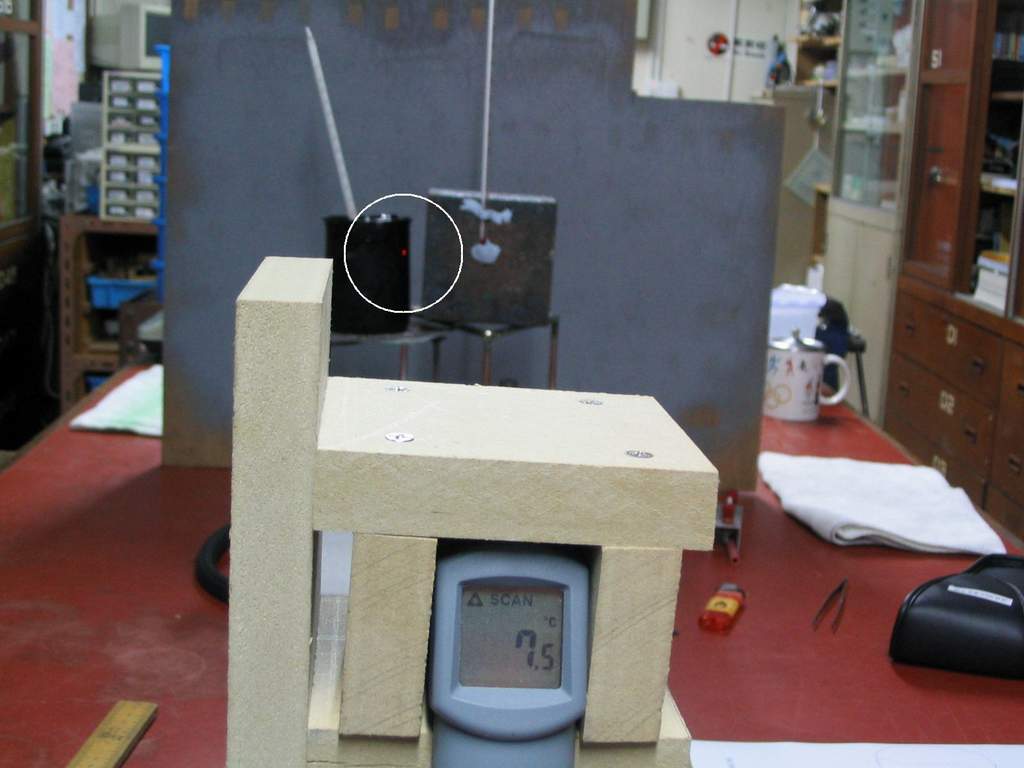
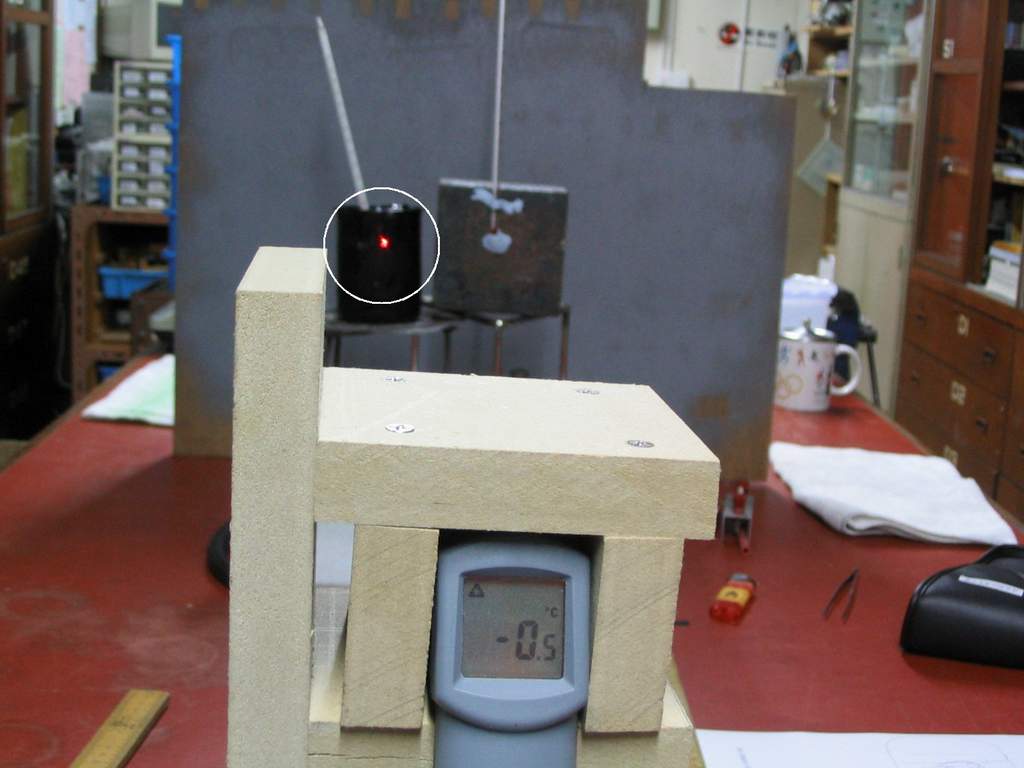
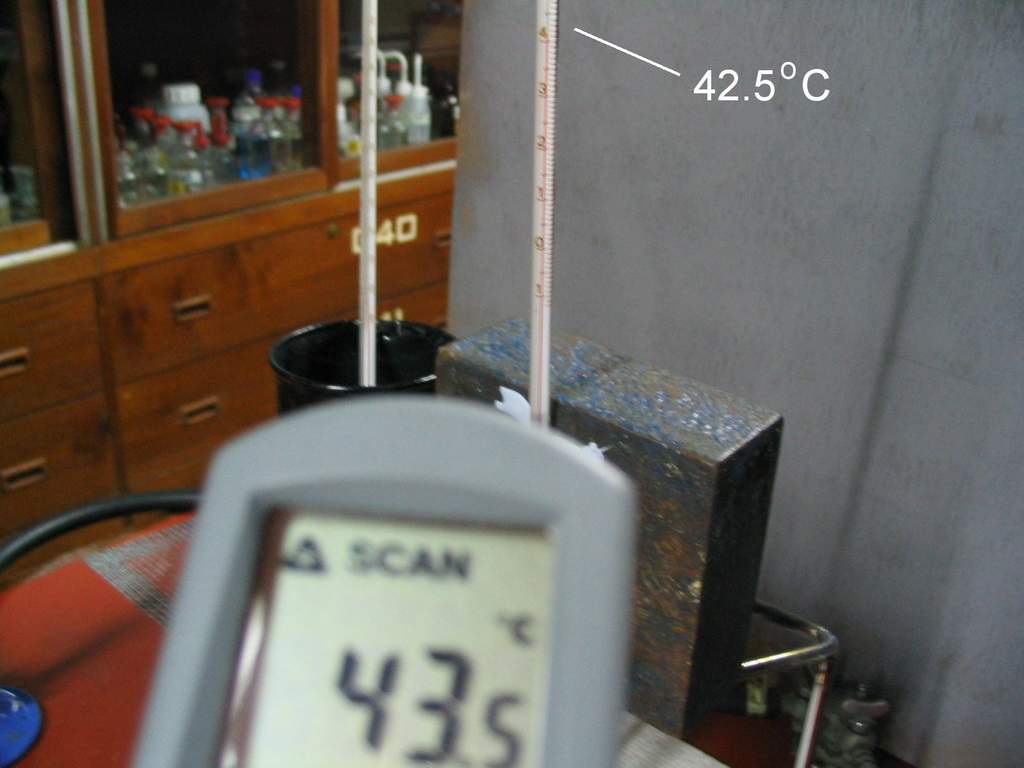
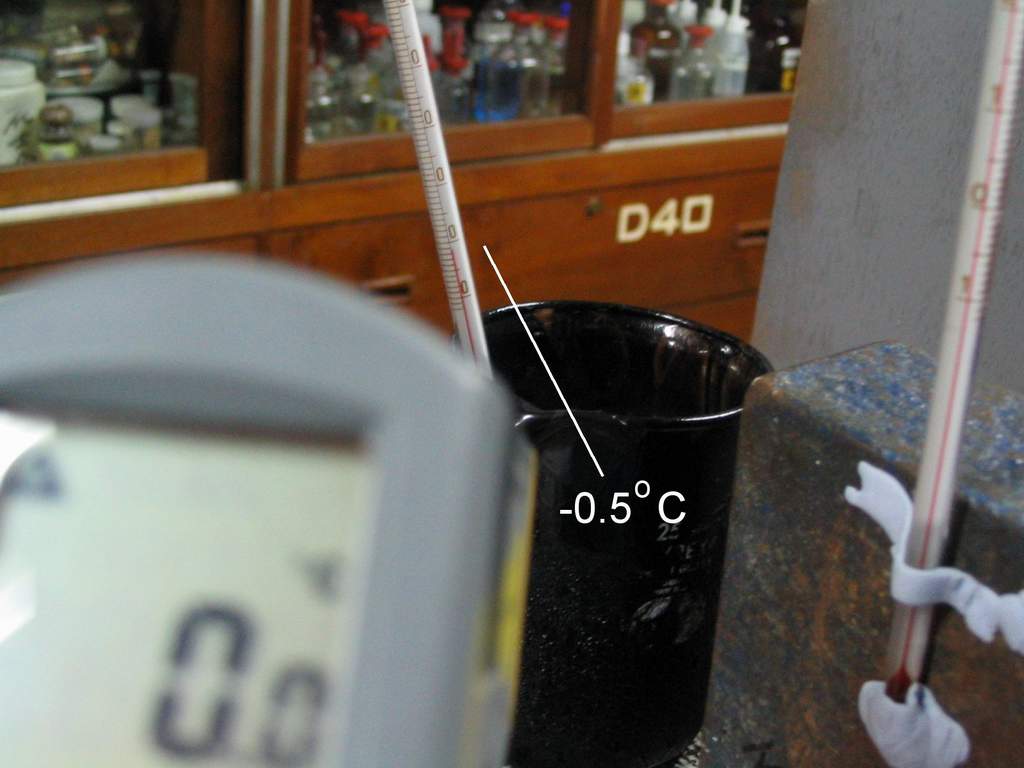
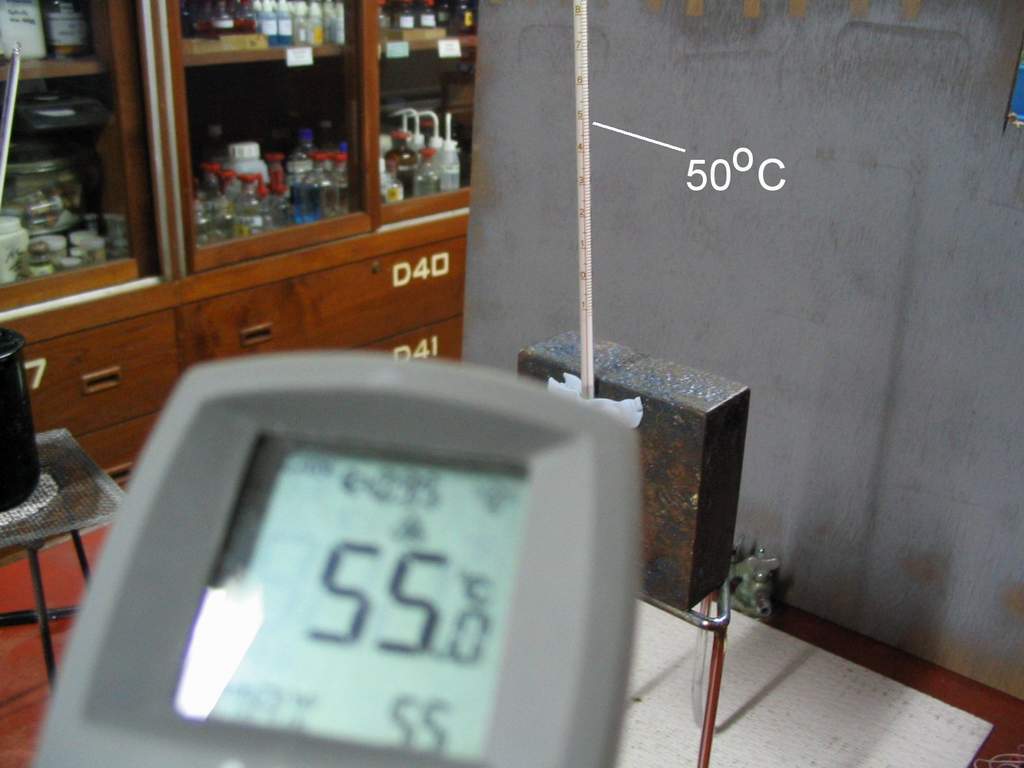
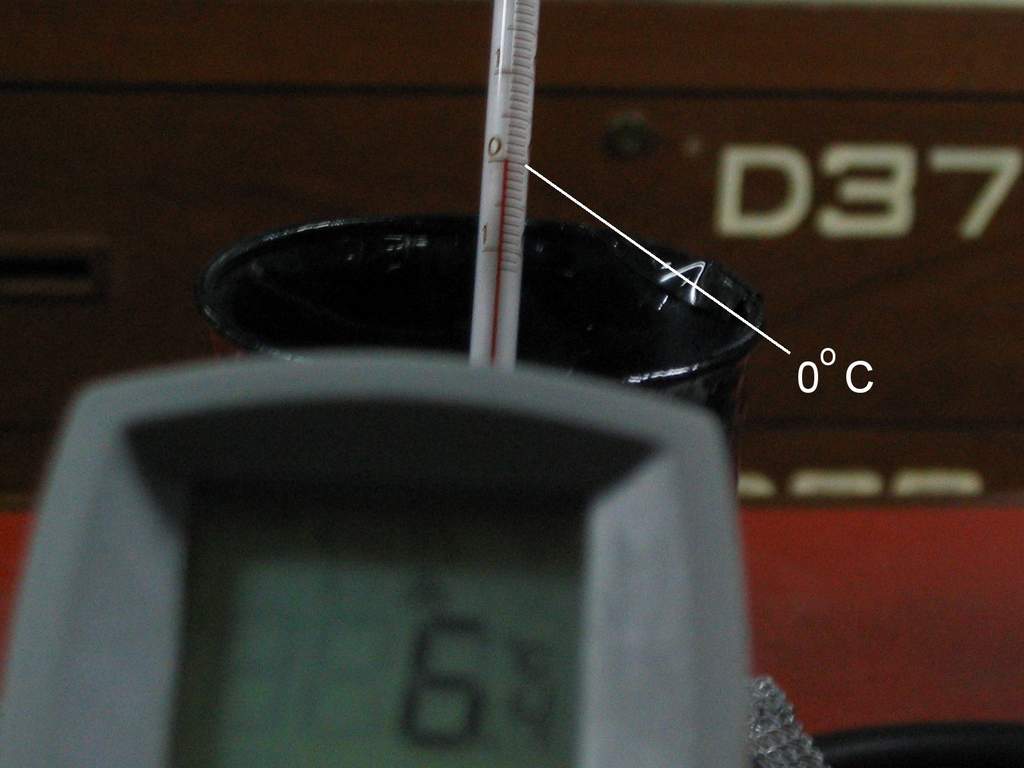
Two
different brands of devices were used to detect a high temperature
(the 3 Kg iron mass heated to about 40-50°C ) and a low temperature
( a black painted beaker of melting ice) for comparison. In both cases,
a common laboratory type of alcohol thermometer was used as reference.
Fig.13 and 14 represents the device said to be inaccurate while Fig.15
and 16 represents the device claimed to be more accurate when measuring
the body temperature of human forehead.
Strange !! Taking
a closer look into the photos, device in Fig.13 and 14 was found more
accurate than that of Fig.15 and 16.
It
was really an interesting finding. Here, we may say that simple conclusions
originated from erratic data could possibly lead to quite an opposite
finding about a phenomenon of science. Our minds were bogged with established
norm values. Many "concepts" have been planted inside our brain so firmly
since we were born and brought up. These "concepts" sometimes reduce our
curiosity in many aspects, mitigate our sensitivity of nuances, and
make us neglect search for solid evidence. We knew from the calibration curve we presented earlier
that the IR non-contact thermometer in our
tests carried a calibration problem. However, it is still an accurate
device on condition that we follow its requirement of distance to spot
ratio as well as confirm the spot covers the region to be measured.
Brand A
Brand
B
Field
of View (Distance
to Spot ratio)
8:1
12:1
Emissivity
0.98
0.95
Temperature
Range
-20
~ 500°C
-32
~ 400°C
Accuracy
±2°C
±1°C(Above
23°C)
±2°C (-18
~ -23°C)
±2.5°C (-26
~ -18°C)
±3°C
(-32 ~ -26°C
Type
of Sighting
Single
spot
Operation
condition
However, for measurement
of human body temperatures, it seems not an appropriate one. Even
with one offering a closer range of reading at the desired zone, the advertisement
of local dealers could be very different from the opinion of the technical
experts from the manufacturer.
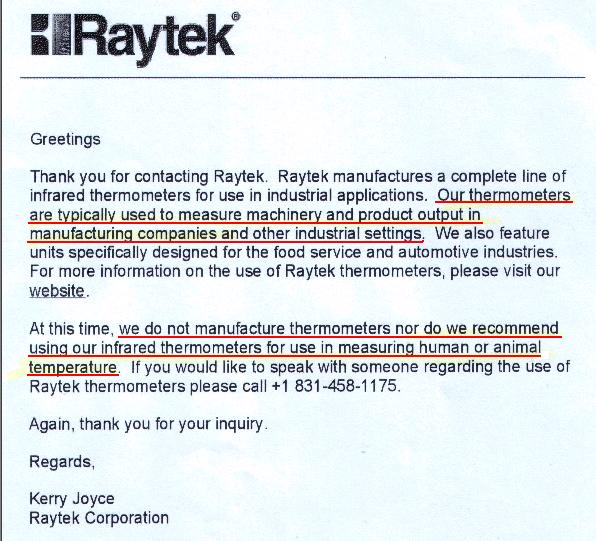
Let us share the official
reply from one of the infrared thermometer manufacturer.
Ask
ourselves the following question :-
(1) Was the IR thermometer
designed for our purpose of measuring human body temperature? The
clue may be in the range of reading that the device serves. If it is
from -20°C through 400 °C or higher, it probably serves
to measure the temperature of a stove, a larger heat source with poisonous
reaction mixture in an industrial process, etc.
(2) What happens
if nobody queried ? We may never have the desired foolproof purpose-built
device. A handy handheld product is still needed in the combat against
fatal diseases that bear early fever symptom. That is another marketable
demand in the future health protection industry.
TO
CONCLUDE ......
USE
THE RIGHT DEVICE
TO DO THE RIGHTTHING !!
Acknowledgement
Special
thanks to Mr. KW Yu of PLK Yao Ling Sun College for technical assistance
in animation effects. We
appreciate the rich information supplied in the catalogue of IR thermometers
provided
by Raytek ( www.raytek.com ). Again,
we express our deepest thankfulness to Raytek for the prompt official reply
in response to our inquiry.
Copyright (C) 2004 HKIEd
APFSLT. Volume5, Issue
2, Article
5 (Aug., 2004). All Rights Reserved.