|
Asia-Pacific Forum on Science Learning and Teaching, Volume 20, Issue 2, Article 6 (Jun., 2021) |
The results of observing student activities with a scale of frequency assessment of student activities are presented in Table I.
Table I. Observation Results of Student Activities
Observed Aspects
Control Group
Experiment Group I
Experiment Group II
P 1
P 2
P 1
P 2
P 1
P 2
AQ - asking questions
4
4
4
4
3
3
GI- giving input on the problem being presented
3
3
3
3
3
3
FN - Find something new (different)
2
2
3
2
2
2
TCT - Try challenging tasks
2
3
2
3
3
3
EA - Explain answers found to other friends
2
2
2
2
3
3
WC - Willingness to come to the front of the class
2
2
2
2
2
2
QRC - Questioning the results of the teacher or student's work and comparing them with their own answers
2
2
2
2
3
3
Total
17
18
18
18
19
19
Average
2.50
2.57
2.71
The result showed that the average activities was between 2.50 to 2.71. This is considered “frequent,” which is higher than 0 to 2.40 and less than 3.0. In the three groups, the most significant activity was asking questions (AQ), giving input on the problem being presented (GI), and finding new / different knowledge (FN). This meant that during the learning process using gamification, the students were sufficiently motivated to engaged in activities frequently (in asking questions, giving opinions and exploring and finding new knowledge). There was a lack of willingness to present in front of the class which can occur because students were more active at their desks playing the computer-assisted game.
These results are aligned to the research by Tan and Hew (2016). In-class games encouraged students to achieve a higher level of engagement in the learning process as well as stimulated activities that support learning. Computer games developed as learning media adds to the potential for learning and entertainment, and encourages interaction between friends (Parra-González et al., 2020).
For the Control Group, the learning outcomes was tested for significance of the difference between the pre-test and post-test. The results obtained are presented in Table II.
Table II. Learning Outcomes of Control Group Students
Test
Number of
Students
Score (max. 100)
sig
Average
Value of t count
% Completion
Lowest
Highest
Df
Pretest
30
3.33%
3.33
80
0.250
27.86
29
12.65
Posttest
30
20.0%
56.67
90
0.108
71.51
- As regulated by the Ministry of Education Indonesia, the evidence of mastery of learning by students is where they have passed the test with a minimum of 75 marks upon 100. In the control group, only 20% of 30 students passed the test at 75%. This meant that it has not met the minimum cut-off point and therefore there is absence of mastery of learning. Also, observations have confirmed that conventional learning media available in the classroom cannot help further improve the quality of learning experience to bring about a higher level of learning outcomes.
- Based on the increase in the average scores of the pre-test and post-test, a paired t-test was conducted. A normality test was carried out and a t-test was conducted in pairs with the SPSS program. Using the normality test of Kolmogorov-Smirnov, the value of the initial sign test was 0.250 and the value of the final sign test was 0.108. The value is greater than 0.05, meaning the initial test score and final test score are normally distributed.
- The t-value of 12.65 is in the rejection area of Ho, meaning that Ha is accepted. This meant that there is a difference in the average score of the initial test and the final test for Control group. This result showed that although learning Chemistry (Atoms and Molecules) using conventional media in class can significantly improve the final test score, but it did not achieved classical completeness.
For the experimental group I (EG I) obtained t-value of 15.44 and experimental group II (EG II) obtained t-value of 17.48. Both of t-value are in the rejection of Ho, meaning that between experimental group I and group II has average score difference of pre-test to average score of post-test.
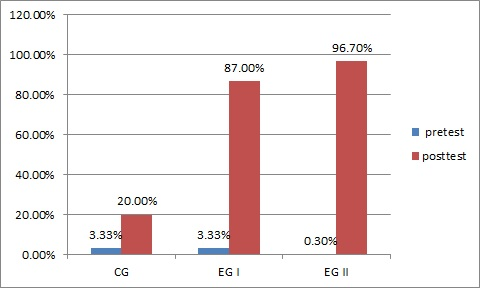
The result of Classical Completeness of the three groups are shown in Figure 1.
Figure 1. Classical Completeness of control group, experimental group I (EG I), and experimental group II (EG II).
Based on figure 1, describe that control group has not reach classical completeness, while experimental group I and group II has passed the classical completeness.
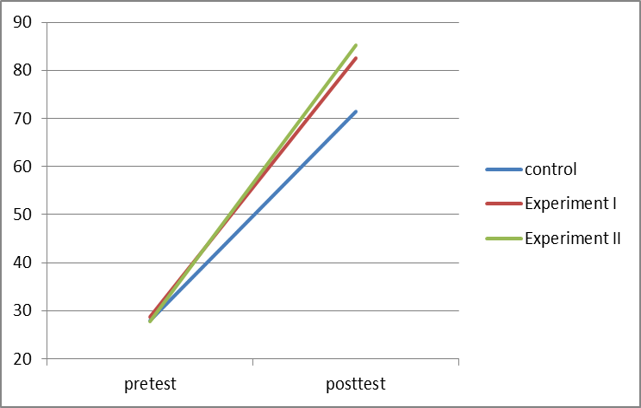
Figure 2. Score of pre-test and post-test in control group, experimental group I (EG I), and experimental group II (EG II).
Based on Figure 2, Shown that boh of experimental groups and control experimental are increased significance on pre-test score to post-test score. This result meanings is altough Chemical learning (Atoms and Molecules) using conventional media in the class can increase post–test score significanly but it can’t reach the classical completenss.
In experimental group I and experimental group II, the results of using computer-assisted games as learning media area presented in Table III below.
Table III. Learning Outcomes of Student Experimental Group I & II
Score
Number of
Complete
Score (max. 100)
sig
Average
df
Value of
Students
Lowest Highest
t value
Pretest EG I
31
3.3%
3.3 80
0.121
28.69
30
15.440
Pretest EG I
31
87.0%
50 100
0.097
82.56
Pretest EG II
31
0.3%
3.3 80
0.252
27.725
30
17.476
Posttest EG II
31
96.7%
70 100
0.400
85.142
For the Experimental Groups I and II, the results revealed that the post-test score was 87% and 96.7%, it has passed the specified criteria of 80% for classical completeness. The price of normality test experimental group I using Kolmogrov-Smirnov on the pre-test score was 0.212 and the price of normality test on the post-test score is 0.097. Both are greater than 0.05, meaning that they are normally distributed.
To test the differences in the average score of the pre-test and the post-test in the experimental group I, the t test was paired with SPSS version 16. The normal distribution requirements were met and the following results were obtained.
Value of t is 15.44 and t table is 2.04, which means that t count is in the rejection area of Ho. This means Ha is accepted, meaning there is a significant difference between the average pretest and posttest scores in the experimental group I at a significance level of 5%.
The scores of student learning outcomes before and after learning, the experimental group II are presented in Table 3.
The value of the level of significance 5% is obtained in the pre-test is 0.252 and the post-test is 0.400. The value is greater than 0.05, meaning that the pre-test and post-test are normally distributed and can be paired with t-tests.
Value of t shows 17.476 in the rejection area Ho means Ha is accepted. This means that there is a significant difference between the average score of the initial test and the final test score. When examined, the student learning outcomes after learning shows that it has reached more than 80% completeness, so that it has fulfilled classical completeness.
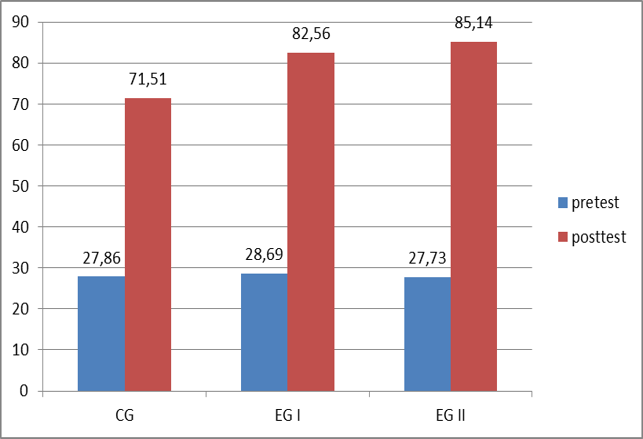
The result of pre-test and post-test between control group and experimental groups are shown in Figure 3.
Figure 3. Score Control Group and Experimental Groups
Based on Figure 3, there is an increase in the average score of pre-test and the average score of post-test for the three groups. However, the increase was higher in the experiment groups.
Next, we compared the average score of the final control class with experimental groups I and II. As the final test score of the three groups has a normal distribution, it has fulfilled the requirement to conduct an independent t test.
Table IV. Independent t Test Results Final Test Score
Group
df
t count
t table
(5%)
Conclusion
Control vs experiment I
59
4.192
2.00
Ho rejected
Control vs experiment II
59
6.560
2.00
Ho rejected
Experiment I vs experiment II
60
1.013
2.00
Ho accepted
Table IV shows the post-test average score of the control group. The average post-test scores of experimental Group I and of experimental group II were significantly different from the average post-test score of the control group. However, the average post-test score between experimental group I and experimental group II did not have a significant difference. This meant that the experimental groups achieved better scores than the control group. The experimental groups also achieved classical completeness.
These results are consistent with the results of Cadavid and Corcho (2018), who studied chemistry learning using computer-propelled games. In their study, students obtain an average yield of 4.1 upon 5.0 (that is 82%). This result is aligned with the results of several studies which state that the computer games can improve learning outcomes (Aşıksoy, 2018, Bai et.al., 2020).
Gamification also has a positive effect on problem solving, achievement in learning (Lin et al., 2018). When used properly, games can be a useful tool in learning the concepts of science (Rachels & Rockinson-Szapkiw, 2018). Activities in the game provide more training in intelligence, through sound, images, linguistics, kinesthetic, interpersonal, and intrapersonal intelligence (Alsawaier, 2018). Likewise, the results study showed that there were significant differences in the scores of learning outcomes between the experimental group and the control group, where which classroom learning could engaged the students better in learning where success depended on how the game was used.
Results of student responses to questionnaire
The questionnaire statement consists of positive statements and negative statements. The results of the questionnaire about students' responses to chemistry learning by using computer-propelled games as learning media are presented in Table V. The lower the scores obtained, the more the indication that students increasingly disliked the activity.
Table V. Results of Questionnaire of Control Group Students
Number
Statement
Score
1
I feel that learning Chemistry with the media has become easier
15 (50.00%)
After learning Chemistry with the media, I became more happy with Chemistry
10 (33.33%)
I want to study Chemistry again with the media
13 (43.33%)
If it's permissible, I want to bring the media home to study at home
10 (33.33%)
I want to tell friends or parents about learning Chemistry.
8 (26.70%)
2*
I felt that learning Chemistry was too long.
7 (23.33%)
I feel that studying Chemistry with the media was boring.
6 (20.00%)
I want to study Chemistry with the media immediately stopped.
5 (16.70%)
The score of the control group questionnaire obtained 5 to 15 upon 30 (that is respectively,16.70% to 50%), which indicated that the students did not give a positive response to the conventional learning that had taken place. The lower score (16.70%) indicated that the student’s desire for learning chemistry tapered off. This meant that students do not like conventional learning with the media available in the class. The low scores indicated that students felt that the conventional learning is less interesting, the duration of the class was too long and hoped that the learning will stop soon.
The results of the student responses questionnaire on learning Chemistry (Atoms and Molecules) in the experimental groups I and II are presented in Table 6 below.
Table VI. Results of Student’s Questionnaire
Number
Statement
Score
Group Experiment I
Group Experiment II
1
I feel that learning Chemistry with the media has become easier
30 (96.7%)
30 (93.75%)
After learning Chemistry with the media, I became more happy with Chemistry
29 (93.5%)
30 (93.75%)
I want to study Chemistry again with the media
31
(100%)32 (100%)
If it's permissible, I want to bring the media home to study at home
30 (96.7%)
29 (90.6%)
I want to tell friends or parents about learning Chemistry.
29 (93.5%
28 (87.5%)
2*
I felt that learning Chemistry was too long.
31
(100%)30 (93.75%)
I feel that studying Chemistry with the media was boring.
30 (96.7%)
30 (93.75%)
I want to study Chemistry with the media immediately stopped.
30 (96.7%)
31 (96.88%)
In the experimental group I, the lowest score was 93.5% and was above the minimum threshold of 75%, while the highest score was 100%. The results of the student questionnaire showed that learning using gamification has set a positive fulfilling response. In the experimental group II, the responses to the questionnaire revealed that students gave a positive reply to agreeing to the use of the computer games as a learning medium. This was reflected by a score between 87.5% to 100%.
The results of the questionnaire showed students studying Chemistry (Atoms and Molecules) had a richer learning experience that was facilitated by computer-assisted games as learning media, which added learning skills and made learning Chemistry interesting. Therefore, students felt they wanted to engage deeper into the subject by using computer-based games.
In summary, the results showed that gamification creates excitement in the classroom learning. This is in accordance with the opinion of Huang et al. (2018) about the use of games as a learning medium. The excitement is described as the rise of interest in full involvement, and the creation of meaning, understanding or mastery of matter, and create happy values for the learner.