|
Asia-Pacific Forum on Science Learning and Teaching, Volume 20, Issue 2, Article 2 (Jun., 2021) |
The results present the teachers' beliefs across the ten NOS issues and the qualitative productions drawn from their personal reflections throughout the TLS-based intervention. Further, the change of teachers’ NOS beliefs was elaborated through pre-test and post-test comparisons and the analysis of the teachers’ qualitative reflections.
Teachers’ prior beliefs about scientific investigations
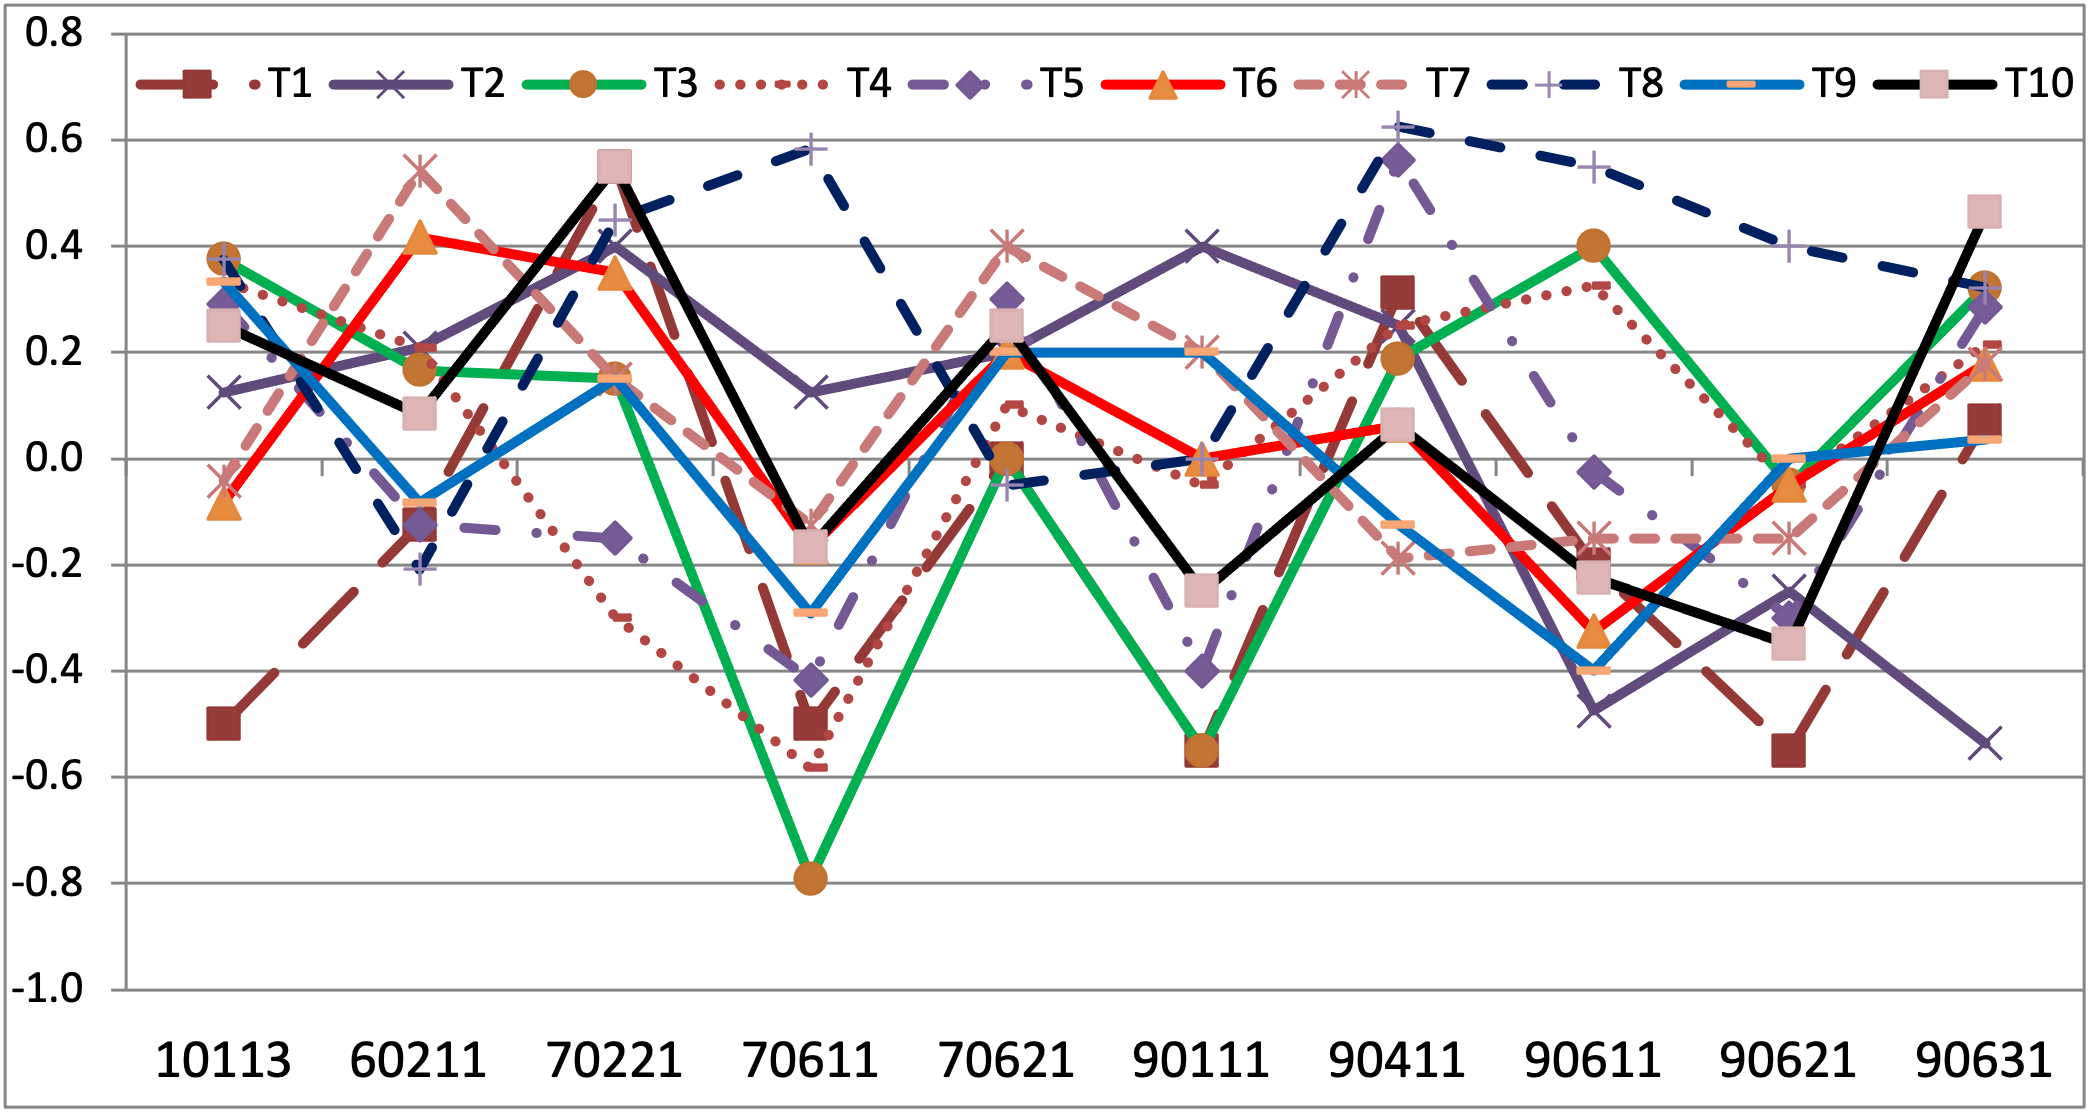
The initial individual baseline profiles for the nine teachers of Cohort 1 across the ten assessment questions are represented by the pre-test question mean indexes (Figure 1), which showed some macroscopic trends. First, the question mean scores showed a broad dispersion across teachers, which means that teachers’ prior NOS beliefs were quite different. For instance, Question 70611 (Scientists’ Personality) presented the largest dispersion across the teachers, and Question 70621 (Brilliant scientists) displayed the lowest dispersion although its top-bottom difference extended over about 0.4 points.
Figure 1. Initial baseline profiles for the ten teachers (Cohort 1) across the ten assessment questions (pre-test mean question indexes)
Second, teachers’ prior beliefs depended on the issue; Questions 70221 (Controversy closure) and 90411 (change) displayed the highest and most positive mean scores, whereas the lowest and most negative score corresponded to Questions 70611 (Scientists’ Personality) and 90621 (Utility).
Third, a slight global positive trend was perceptible, as Figure 1 displayed more points above zero than below zero across the ten questions; in fact, the cohorts’ great mean was slightly positive (+.080).
The above qualitative features of teachers’ initial NOS beliefs hold broadly for the second cohort although the representative questions may vary somewhat. Thus, these features allowed concluding that the initial beliefs were very variable across teachers and questions. Moreover, they were not definitely positive, thus confirming previous research that claims that teachers’ NOS education is insufficient and inadequate to qualify them for quality NOS teaching.
The appraisal of teachers’ change of their NOS beliefs is based on the effect size of the differences between the final (post-test) and initial (pre-test) mean indexes for each of the ten questions (Table II). Overall, teachers improved in most questions, as Table II displays a majority of positive effect sizes (111/190, 58.4%) and fewer negative effect sizes (79/190, 41.6%), revealing an overall improvement in teachers’ NOS beliefs.
Table II. Teachers’ change profiles across the ten assessment questions between post-test and pre-test mean indexes, represented through the effect size of the differences for each question.
Teachers
Assessment questions
Teacher
10113
60211
70221
70611
70621
90111
90411
90611
90621
90631
Mean
T1
0.847
0.236
-0.495
1.025
0.548
0.975
-0.136
0.435
0.802
0.195
0,411
T2
-0.266
-0.428
-0.257
-1.047
0.230
1.109
0.355
1.202
-0.419
1.070
0,194
T3
-0.274
0.094
0.550
0.423
-0.061
-0.305
0.000
-0.139
-0.061
0.049
-0,011
T4
-0.139
0.407
0.108
1.030
-0.493
0.429
0.346
0.141
0.215
0.427
0,226
T5
0.082
0.742
0.336
0.111
-1.520
0.209
-0.965
-0.103
0.668
-0.084
0,016
T6
-0.307
-0.433
-0.567
0.308
-0.921
-1.813
-0.385
0.402
0.525
0.327
-0,209
T7
0.237
-0.551
0.000
0.000
-0.956
-0.500
0.167
0.643
0.394
0.230
0,095
T8
-0.553
-0.113
-0.233
-1.008
1.154
-0.196
-0.474
-0.529
0.000
0.086
-0,193
T9
0.075
0.735
0.259
0.063
0.473
-0.176
0.089
0.442
-0.217
-0.066
0,156
T10
0.506
0.166
-0.807
0.499
0.000
1.746
-0.578
0.859
1.298
-0.093
0,430
T11
1.640
0.000
0.490
0.684
0.757
0.236
0.000
0.331
-0.061
-0.521
0,224
T12
-0.169
0.651
-0.115
0.378
-0.633
-0.704
0.000
0.503
0.000
0.790
0,114
T13
0.554
-0.504
-0.428
0.252
0.132
-0.867
0.000
1.413
-0.316
-0.139
0,115
T14
0.530
-0.214
-0.642
0.000
-0.657
-0.947
-0.150
0.471
0.317
-0.162
-0,052
T15
0.413
0.725
-0.685
0.000
0.000
-0.585
0.521
0.491
-2.079
-0.085
-0,057
T16
-0.306
-0.515
-0.874
0.360
0.000
0.168
0.448
-0.100
-0.279
0.167
-0,085
T17
0.332
-0.855
-0.706
-1.071
-0.510
-0.179
0.317
-0.048
0.182
0.516
-0,141
T18
0.984
-0.577
1.016
-0.208
0.101
-0.817
-0.425
0.511
1.411
-0.139
0,133
T19
-0.244
0.328
-0.226
0.377
0.102
0.000
0.747
0.428
0.000
0.553
0,201
Question
Mean0.208
-0.005
-0.172
0.115
-0.119
-0.117
-0.006
0.387
0.125
0.164
Five of the ten questions reached a positive mean effect size (d>.10), only three questions reached a negative, albeit nonsignificant, mean effect size (-.20<d<-.10), and the remaining questions hardly changed, with a close-to-zero effect size (.10<d<.10). Question 90611 (Scientific method) reached the highest positive effect size improvement, which is close to the significance threshold, and Question 70221 (Controversy closure) reached the lowest negative effect size improvement.
It is well known that the sample’s overall mean decreased the measurement variability, so that it underestimated the effect size. In fact, the effect size of the individual questions across teachers (inner cells, Table II) showed higher scores than its great mean (last row, Table II). For example, Question 90611 (Scientific method), which reached the largest average effect size, showed that 12 teachers exceeded the minimum threshold effect size (d>.40), with some teachers exhibiting high scores (Table II), although the question’s great mean did not reach the minimum threshold (d<.40).
The analysis of the teachers’ changes across the final-initial differences (last column, Table II) showed the uniqueness of each teacher's evolution. Most teachers (10) improved their NOS beliefs (d>.10), and two teachers exceeded the minimum significant effect size (d>.40). These two teachers displayed six and five questions that reached a large significant effect size but the presence of one and two questions, respectively, whose effect size was significant and negative, is also noteworthy.
In contrast, only three teachers reached an overall negative effect size (d<-.10), although none of them even reached one half of the effect size threshold. Again, these three teachers with negative global change profiles presented one question that reached a significant and positive effect size. The remaining teachers (6) displayed an overall close-to-zero effect size, and their profiles across questions displayed a variable number of questions with significant effect size scores, either positive or negative.
The teachers’ change pattern was quite inhomogeneous and inconsistent across questions, as each teacher simultaneously exhibited significant positive and negative changes, that is, questions that worsened and questions that improved their profile. The teachers with the highest positive improvement profiles also displayed some questions with significant negative effect sizes, and conversely, the teachers with the lowest negative change also displayed some questions with significant positive improvement.
The elaboration and presentation of the TLS on investigations and the answers to two self-reflective questions about their test results are some products of the teachers’ reflections on NOS issues that could contribute to another qualitative study by themselves. However, the available space limits its presentation to some core results of the first cohort’s personal reflections on their question ratings. The instructor provided each teacher with their own ratings and requested two responses about each assessment question: "explain the reasons for your ratings" and "explain the reasons that justify your change/no change in each question when comparing your first responses to the second ones.”
Table III. Excerpts of teachers' reflections on the first reflective item (Explain the reasons that justify your ratings) across three significant teachers and three assessment questions
Teacher displaying the highest positive change
Teacher displaying the lowest negative change
Teacher displaying the largest absolute change
10113
I find acceptable those responses that describe the process of doing science as a set of activities-methods designed to explain our environment (nature-world-universe). The phrase D (use of technology to discover Nature) does not seem acceptable because it is limited to a single way of doing science, such as the use of technology.10113
For me, the process of doing science is to discover the mysteries of the universe and the behavior of Nature, using new technologies and qualitative and quantitative methods.10113
I agree to a greater or lesser extent with all the answers. Therefore, I have given them all a score above 6. The premises that I think best describe the process of doing science are everything we do, discovering order and proposing and validating explanations, so I gave them a score of 8 (high agreement).90111
Observations are the results of the experiment directly (without treatment) or sanitized results.
Sometimes, treatment can produce incorrect data or erroneous observations.90111
The observations are always the same but either they cannot explain all the knowledge or they will differ very little, depending on the theories.90111
Observations must always be objective, but the interpretation of what we see will depend on the mindset and ideas of each person.90621
I think the best scientists are those who use any method (including the scientific method) to obtain results.
The serendipity of many discoveries shows that it is really not necessary to always follow a particular method.90621
Scientists using the proper scientific method in their field will achieve better results, but chance discovery also produces occasional successes.
The scientific method is subject to change but these changes must be based on scientific arguments, to avoid achieving false results.90621
I agree with the idea that most scientists continue to use this method for their research because it assures valid, clear, logical and accurate results, although these results can also be negative.Table III presents verbatim some exemplar excerpts of the responses to the first item by three prototypical teachers: the teacher who achieved the overall highest improvement, the teacher who achieved the lowest negative change, and the teacher who achieved the highest absolute changes, either positive or negative. Overall, the excerpts display another facet of the results and exemplify the teachers’ diverse evolution patterns across the informed and misinformed NOS conceptions. Further, they also display the subtlety of the nuances that differentiate the teachers’ positions from each other, and between informed and misinformed conceptions.
The highest-improvement teacher justifies his responses, considering the centrality of scientific explanations in the process of doing research, stating that observations are much more than simple data and any method is useful to obtain results. The lowest-improvement teacher sustains traditional positivist positions on science (discovering the mysteries of the universe and the behavior of Nature) and observations (observations are always identical) but he considers that theories can project some influence on the observations; he also views the scientific method as the way to achieve better results, while simultaneously acknowledging that “scientific method is subject to change.” The highest-change teacher expresses an informed view on observations, a holistic conception of science as a process, and also stresses the centrality of explanations; however, she joins the traditional positivist views in her conception of the scientific method.
The second item requests teachers to identify and explain the changes produced in their thinking when comparing their initial and final responses. Overall, teachers' responses to this requirement followed two different patterns: on the one hand, a concrete pattern, specifying and mentioning the question phrases where they perceived the presence or absence of change; on the other hand, a generic pattern, when the teacher acknowledged change/no change, without mentioning specific evidence.
For instance, Teacher #2 rightly argues for a change in question 70611 (Scientists' personality) through this specific reasoning: