 |
Asia-Pacific Forum on Science Learning and Teaching, Volume 20, Issue 1, Article 4 (Aug., 2019) |
Data from the students’ interviews revealed that the research course (the optics course) was more interactive than other courses.
- I think the interaction between teacher and students in this optics course is more interactive than other courses that I have studied. It is because in the other courses the lecturers talked most of the time, and the students listened and hardly had opportunities to talk or present our ideas. (SI_AGW15)
In addition, the degree of interactions with the learning environment of the optics course also increased during the semester. The interactions within this learning environment can be divided into three types: students–students interaction, students-learning material interaction and students-teacher interaction. From the analysis of the students’ interviews, themes related to how these types of interaction occurred within the learning environment emerged. The following sections narrate students’ stories through the emerging themes and types of interaction.
Students–students interaction
Student interview data showed there was a wide range of ways the students interacted with each other. For example, they worked in groups outside class, and discussed and carried out learning tasks. They shared the workload among group members in order to complete their learning tasks. Other examples of students–students interaction are in class discussion, exchanging ideas and solutions for assignments, explaining optics topics to their peers and online discussions.
The students were given learning tasks (for example, preparing presentations to explain optics topics to their classmates). They worked in groups and had group discussions to prepare for the presentations.
- It is because the lecturer asks us to prepare the presentations in groups, we discuss [with each other]. For other courses we don’t need to prepare presentations and work in groups. So we don’t discuss. (SI_AGW14)
The students also noted that they shared the workload. For example, if their group was going to present a topic on optics, the topic contained 10 optics lessons and there were five students in the group, group members decided each person should do the research for two optics lessons. One member of the group then combined the work of the whole group.
- [We divide the workload] equally. For example, if the topic has 10 lessons and our group has 5 members, each of us will have 2 lessons. Then there is a person to combine the work. It is similar for assignments. We divide the assignments equally among us. (SI_AGW14)
In class, the students also explained optics topics and solutions for assignments to their peers. They asked questions and shared ideas. In this way the students thought that they saved time for studying and understood optics in more depth.
- The second strong point is assignments. Each group explains an assignment. This helps to save time. We have many groups, so we can discuss the assignments. If we don’t understand an assignment we will exchange and discuss . . . If a group doesn’t know [how to solve an assignment] they can ask other groups. (SI_MGW14)
- I work on the presentation one time, then listen to the presentation of classmates one time and listen to the explanation of the teacher once more. Therefore, the optics knowledge is more in-depth compared with other courses. (SI_AGW15)
Students–learning material interaction
According to the students, by working on the learning tasks given by the lecturer they needed to do lots of reading and researching. In this way they could learn more.
- The lecturer requires us to prepare a presentation for each topic. This helps us learn more and learn all of the content. (SI_AGW7)
- [I] go to a physics web page, read and research the content. [I] read and find something related to the lecture notes and something the lecture notes do not explain clearly. [I] look for it and read it. (SI_AGW14)
Students–teacher interaction
The students felt that the degree of students–teacher interaction was high in the optics course. They stated that they had more opportunities to discuss things with this lecturer compared with other courses. The lecturer usually asked questions in class. The purpose of these questions was to guide the students to think and explain the optics topics to their peers. The students contributed to the discussion in the class and so co-constructed their knowledge of the topics. If the lecturer felt that the topics were not fully explained by the students, he would provide further explanations.
- I like [the course] because I have more opportunities to discuss with the lecturer. (SI_AGW14)
- The teacher asked students questions to help students understand the topic . . . [if] they could not explain to each other, he would explain. Not like other teachers. (SI_MGW14)
ICT promoting social interaction
The students used ICT to support face-to-face presentations. From these students’ point of view, using ICT helped to attract their classmates’ attention and make learning enjoyable.
- When teaching with ICT, we have photos and video clips. This attracts students’ attention. (SI_AGW15)
- PowerPoint presentations help students study more easily, help reviewing lessons become relaxing and enjoyable, make learning more surprising and exciting. (SI_AGW15)
The students also stated that the lecturer created opportunities for them to interact with online learning resources. He also provided the students with learning environments, both face-to-face and online, in which they were encouraged to exchange and present their ideas, and actively participate in the lessons.
- The teacher lets us comfortably exchange ideas and look for online resources. I think this helps us enrich our knowledge. (SI_AGW15)
- When we have questions, we send the questions to LMS. The teachers then answer us clearly and in detail whenever they have time. (SI_MGW15)
Comparing students’ pre-test and post-test scores
The CCTST was employed in the research. The same test was used for the pre-test and post-test. The test results show that there are statistically significant differences in total score and five individual scale scores for students’ pre-tests and post-tests.
The CCTST results of the students (in both groups) show that the critical thinking skills scores of the students in the post-test is significantly higher than in the pre-test (Table 2). The mean of the total score in the post-test increases 1.8 (out of 34) (p = 0.001) compared with the pre-test. The five critical thinking subscores – analysis and interpretation; inference; evaluation and explanation; induction; deduction – also showed a statistically significantly improvement by the end of the semester (p ≤ 0.037). The figures in this table show that the means of the thinking skills inference induction and deduction increase more than the means of analysis and interpretation skills and evaluation and explanation skills. The mean differences of inference, induction and deduction skills are 0.85, 0.89 and 0.91 respectively, while the mean difference of analysis and interpretation is 0.41, and evaluation and explanation 0.54.
Table 2. Combined test results
Critical thinking skills
Pre/Post
N
Mean
SD
Mean difference
p (2-tailed)
Total
Post
89
13.72
3.50
Mean difference = 1.80
p (2-tailed) = 0.001
Cohen’s d = 0.53 (moderate)
Pre
90
11.92
3.31
Analysis and interpretation
Post
89
4.09
1.28
Mean difference = 0.41
p (2-tailed) = 0.037
Cohen’s d = 0.31 (modest)
Pre
90
3.68
1.34
Inference
Post
89
6.19
2.15
Mean difference = 0.85
p (2-tailed) = 0.009
Cohen’s d =0.39 (modest)
Pre
90
5.34
2.16
Evaluation and explanation
Post
89
3.44
1.48
Mean difference = 0.54
p (2-tailed) = 0.017
Cohen’s d = 0.36 (modest)
Pre
90
2.90
1.50
Induction
Post
89
6.98
2.39
Mean difference = 0.89
p (2-tailed) = 0.009
Cohen’s d = 0.40 (modest)
Pre
90
6.09
2.09
Deduction
Post
89
6.74
2.38
Mean difference = 0.91
p (2-tailed) = 0.009
Cohen’s d = 0.39 (modest)
Pre
90
5.83
2.26
Students’ reflections on the improvement in their critical thinking skills
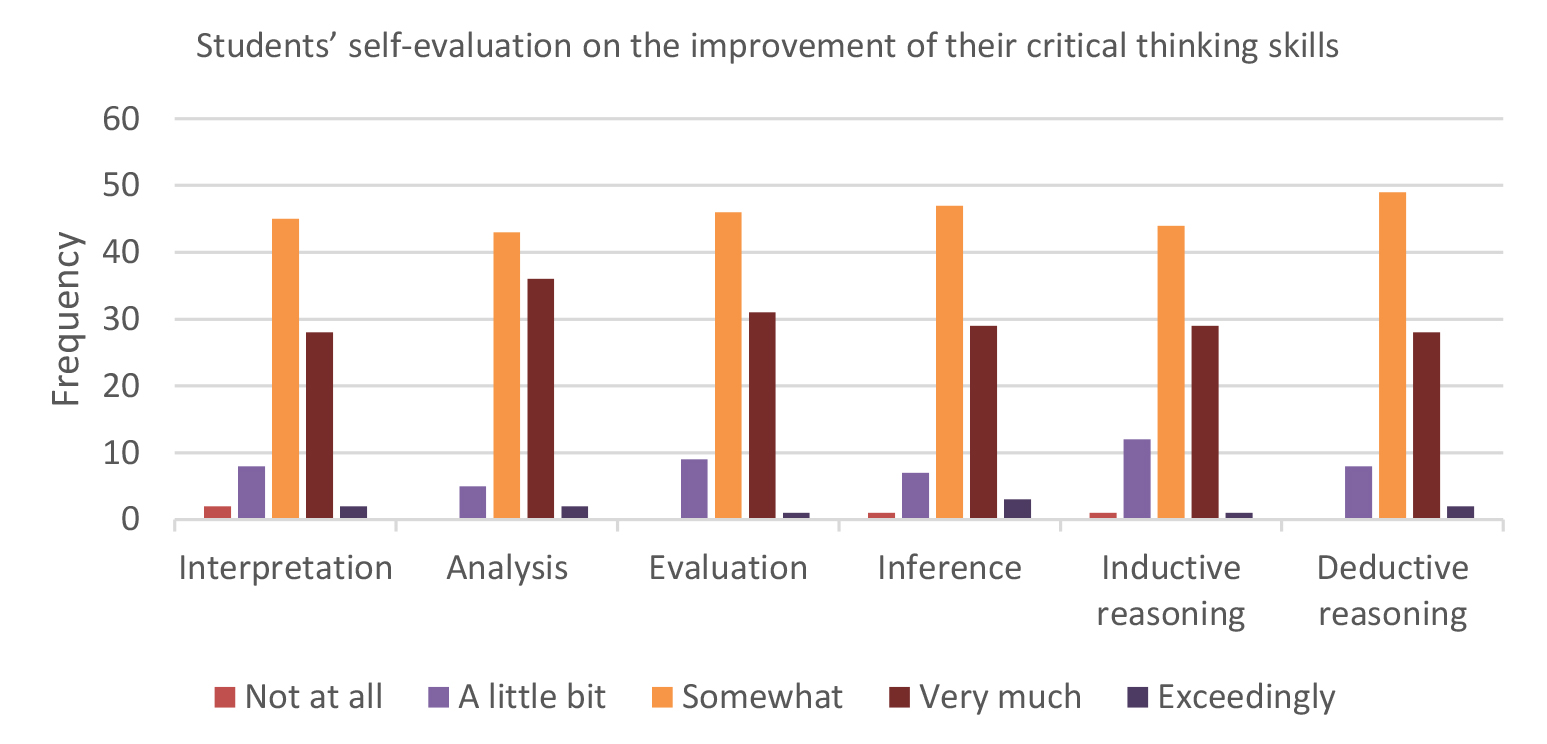
The questionnaire administered to the students at the end of the semester also included seven questions on critical thinking skills. The students were asked to evaluate to what extent their thinking skills had improved after this optics course in a Likert scale (not at all, a little bit, somewhat, very much and exceedingly). The critical thinking skills mentioned in these questions consist of interpretation, analysis, evaluation, interference, explanation, inductive reasoning and deductive reasoning. Cronbach’s alpha reliability coefficient of the seven items measuring critical thinking skills was 0.872 – high reliability (Cohen et al., 2011).
Fig. 2 Students’ self-evaluation on the improvement of their critical thinking skills
The results from the students’ self-evaluation on the improvement of their critical thinking skills is presented in Fig. 2. In general, most of the students who participated in the research believed that their critical thinking skills had improved to a certain extent, from a little bit to exceedingly. A majority of them said that their skills had improved somewhat or very much. Just a few students considered that their thinking skills had not been enhanced at all.
Students’ learning and physics test results
To examine if the students’ optics performance had improved after the implementation of the CSI model, the students’ pre-test and post-test scores were compared. Data from interviews with groups of students was used to supplement data from optics test results. The optics test was an exam paper that was used in 2009. The test included 40 items and was designed by the lecturer, and the same test was used for the pre-test and post-test.
Comparing students’ pre-test and post-test scores
The paired-samples t-tests were used to examine the impact of implementing the model. The use of paired-samples t-tests meant that only test scores of students who attended both the pre-test and post-test were used for the comparison in the t-test. In Group 1, the test scores of 46 students who sat both tests were used to conduct the t-test, while in Group 2, the test scores of 32 students were used.
The results of the students’ optics tests show that there are statistically significant differences between the pre-test and post-test results of the students in both groups. In general, the test scores in the post-test are higher than the scores in the pre-test. The following statistics explain in detail the differences in the test scores.
Table 3. Optics test results of Group 1
N
Mean
SD
p (2-tailed) = 0.000
Mean difference = 15.39
Cohen’s d = 3.80
Pre-test
46
13.37
3.84
Post-test
46
28.76
4.26
In Group 1, the students’ optics test scores improve considerably and significantly. Table 3 and the numbers can be explained in a simple way as the average number of correct answers that a student in Group 1 performed in the optics pre-test is 13.37 out of 40 answers; this number for the optics post-test is 28.76. It means that Group 1 students’ post-test scores were higher than their pre-test scores, and a student in the post-test generally supplied 15.39 more correct answers than in the pre-test. In statistical terms, if the probability value (p) is equal or less than 0.05, the result will be considered as statistically significant. The probability value ‘0.000’ is substantially smaller than the specified probability value of 0.05. Therefore, it is concluded that there was a significant increase of 15.39 (out of 40) in the optics test scores from the pre-test (prior to the model implementation) to the post-test (after the model implementation).
Table 4. Optics test results of Group 2
N
Mean
SD
p (2-tailed) = 0.004
Mean difference = 3.80
Cohen’s d = 0.85
Pre-test
32
12.97
2.44
Post-test
32
16.77
6.45
Table 4 presents a comparison between students’ optics test results pre-test and post-test (paired-sample t-test). There was a statistically significant difference between the pre-test and post-test of the students in Group 2. The mean of the pre-test is 12.97, and the mean of the post-test is 16.77. The mean difference of 3.80 shows that on average each student gains 3.80 more correct answers in the post-test, compared with the pre-test. The probability value 0.004 and Cohen’s d = 0.85 reveal that the optics test scores of Group 2 increase moderately and significantly.
Comparing Group 1 and Group 2
The CSI model was implemented in both groups, with one difference in the application: Group 1 used an online learning management system for optics study, while Group 2 did not. An independent sample t-test was conducted to evaluate the difference between the two groups. The students’ pre-test results show that there is no statistically significant difference between Group 1 and Group 2 (mean difference = 0.45, p = 0.515) (Table 5). In simple words, Group 1 and Group 2 are considered to be similar to each other in the optics test scores at the beginning of the semester.
Table 5. Optics pre-test results of Group 1 and Group 2
Group
N
Mean
SD
p (2-tailed) = 0.515
Mean difference = 0.45
Group 1
46
13.37
3.84
Group 2
40
12.93
2.39
Table 6. Optics post-test results of Group 1 and Group 2
Group
N
Mean
SD
p (2-tailed) = 0.000
Mean difference = 11.96
Cohen’s d = 2.23
Group 1
53
28.74
4.28
Group 2
35
16.77
6.45
Table 6 describes a comparison of optics post-test results between Group 1 and Group 2. The post-test mean is 28.74 for Group 1 and 16.77 for Group 2. Mean difference is 11.96 (sig. 0.000) and effect size – Cohen’s d – is 2.23 (strong effect). At the end of the semester the students in Group 1 supplied about 12 more correct answers (out of a total of 40 answers) than the students in Group 2. The post-test results of the students in Group 1 are significantly higher than the results of those in Group 2.
Interviews with students: Physics learning
The students felt that this new way of teaching helped to enhance their physics learning. It engaged them more in the learning and helped them comprehend the physics lessons faster, and they had a better understanding and became more active, dynamic and independent learners.
Findings from the students’ focus group interviews showed that the students attending the optics course were deeply engaged in learning. They had read learning resources and researched optics lessons before they went to classes. They invested a lot of time studying optics at home.
The students stated that they comprehended physics lessons faster, more easily and better using this teaching method. According to the students, the applications of ICT such as computers, LCD projectors, videos and photos attract their attention and help them to comprehend optics faster and more easily. It helped them obtain in-depth understanding and enriched their optics knowledge.
The students said they became more active in learning and understood the topics more deeply.
- When the lecturer gives us tasks, we will understand specific work to do at home. We become more active in studying knowledge. When we want to stand in front of our classmates to talk, we need to understand the knowledge deeply and in detail so that we can talk. (SI_MGW14)
Moreover, the students indicated that comparing the classes at the beginning of the semester to the classes that occurred later in the semester, their classmates contributed to the lessons more actively. The learning environment was more fun. They became more dynamic and volunteered to solve assignments.
- I see the classroom is more fun and my classmates talk and contribute to lessons more actively than they did at the beginning of the semester . . . For me, my classmates become dynamic and volunteered to solve assignments. (SI_AGW15)
The students also stated that they were trained during the optics course and became more independent in their learning. The lecturer required students to research optics topics and provided them with guidance.
- For the optics course of this semester, from my observation, there is a great difference between this optics course and other courses. The lecturer lets us do research on each topic at home. Then we discuss in class. Students play roles of lecturers. (SI_MGW14)
The interviewed students believed that this way of teaching helped them develop necessary skills for learning, such as working with computers, seeking information, presenting and explaining ideas.
- I believe that when I study this course I have developed skills such as the skill of talking in public, skill of working with computers and find information online. (SI_AGW15) Learning this course I become more dynamic and learnt how to present the idea I wanted to say. (SI_MGW15)
Although the majority of students considered investing a lot of time in studying optics outside the class benefited their study, a few students perceived this is a weakness. One student said that he took many courses at the same time, so he did not have enough time to study other courses.
Technology barriers could be a challenge for utilising ICT to support learning. Some students who participated in this research did not have computers at home. They used computers in the university labs for their study. This did not help remove the technology barrier totally, but to some extent helped them to overcome the barrier.
![]()
![]()
![]()
Copyright (C) 2019 EdUHK APFSLT. Volume 20, Issue 1, Article 4 (Aug., 2019). All Rights Reserved.