 |
Asia-Pacific Forum on Science Learning and Teaching, Volume 19, Issue 2, Article 9 (Dec., 2018) |
Discussing prior conceptions of the seasons
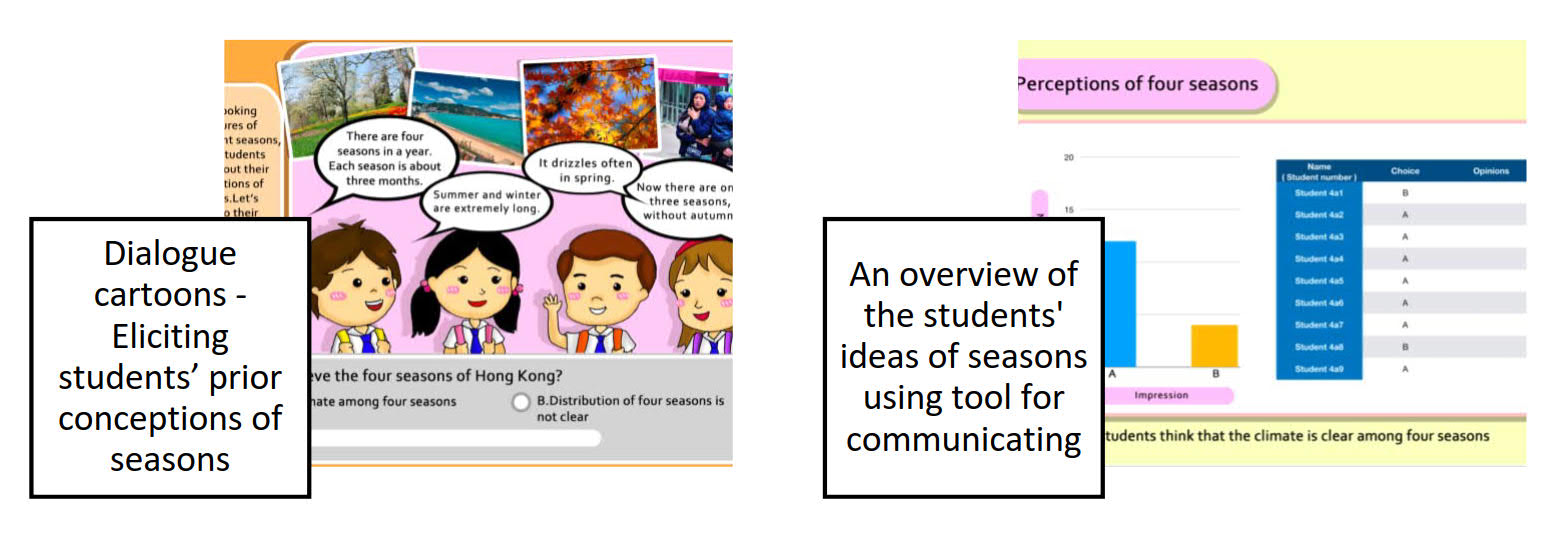
At the very beginning, the students were directed to engage in the voting game. Figure 1 shows the interface of this game. During the game, the students were asked to listen to what the dialogue cartoon says, and then answer a single-choice question about whether the weather of each season is different or similar. While answering the question, the students were encouraged to think about the reasons to justify their answers. Once they had answered the question, they were required to upload their answers to the online forum for sharing (as shown in Figure 1). After the majority of the students successfully uploaded their responses, whole-class discussion was held. The students with different opinions were encouraged to share their opinions with justifications.
Excerpt 1 shows how the whole-class discussion unfolded, particularly, how the students explained their answers with certain justifications. As shown in the excerpt, both students (S1 and S2) agreed that the seasons are different, but they gave different evidence. S1 found the change in the color of leaves across the seasons, while S2 found that people wear different coats in different seasons. After listening to the two students' answers, the other students who thought seasons should be the same changed their minds and constructed new understanding of the seasons.
Excerpt 1
Teacher (T): What do you think? Is there any difference between the four seasons?
Student 1 (S1): Yes, because there are four seasons, and the four seasons have many differences. Samuel listen, some seasons are hot and some cold, and in some seasons the leaves turn yellow.
S2: Um, because it is not different, we do not wear big coats in the winter.
T: Ok, that means you think that in winter, you wear thick coats. Why do you need to wear the thick coat?
S2: Because it is cold.
T: No? How about you, Samuel [the students who agreed the seasons are the same], others? No more? OK. It seems Samuel and those who thought seasons should be the same have changed their minds, right? They changed their minds to different, because they find that some prove the seasons are different. If not, we won't wear different coats, right?
Excerpt 1 suggests that during the voting activity and the use of the online forum, the students were provided with opportunities to share, but also to explain their opinions, which helped them to exercise evidence use in explaining personal ideas. The sharing of ideas among the students made it possible for those students who held alterative conceptions of seasons to develop accepted concepts. Moreover, the interactions between the teacher and the students were facilitated to some extent. According to students' walkthroughs, the online forum enabled the teacher to better understand the students' opinions, and this led to more effective teacher-student communication. For instance, one student said in the walkthrough, "The teacher checked if all students got correct answers on the forum. If not, the teacher could give more explanation of the science ideas to enhance our understanding."
Figure 1. The interface of the voting game and the students' responsesDiscussing prior conceptions of season distribution
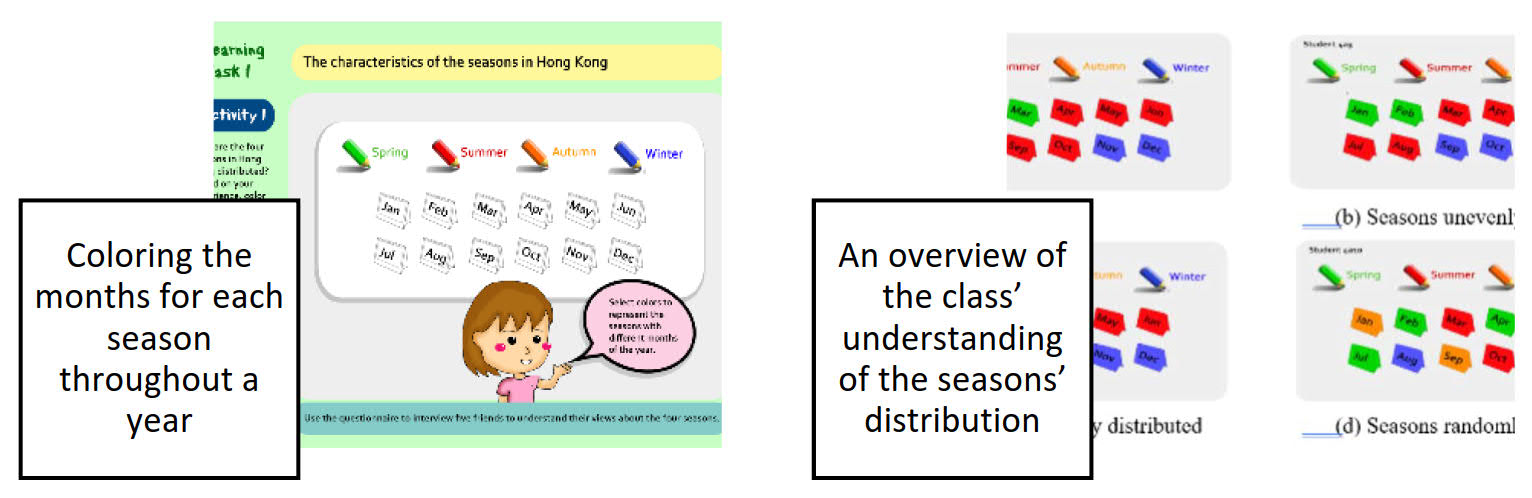
Through an activity using e-painter to color the months for the different seasons, the students learnt about how seasons are distributed throughout a year. Their coloring results were uploaded and shared with peers for an overview of the class' understanding of the seasons (Figure 2).
During the activity, the students were firstly arranged to work on this activity in small groups and then they were required to upload their answers to the online forum. After that, the teacher showed each group's answer one by one on the big screen. As shown in excerpt 2, Group 1 agreed that spring should be the longest, while Group 2 believed that winter should be longer than the other seasons. These groups of students thought the distribution of seasons should be uneven. Looking at these answers, it could be found that some students held alternative conceptions of the distribution of seasons. The walkthroughs showed consistent results that some students expressed alternative conceptions of seasons, some of which were incomplete or incorrect during the lesson. For instance, student 3-1 saidin the walkthrough, "The responses are different. There are blanks in some responses; or there is only winter or only spring; or first autumn, then spring, and autumn again." These alternatives might come from the students' daily experiences. In Hong Kong, May to August are hot and humid. This might result in some students feeling that summer is longer than the other seasons.
Excerpt 2
T: There should be three months in a season, right? Should be, but sometimes say oh no. Let's check the answer together, ok, group 1, they think that summer is longer than the other seasons, summer has five months. Group 3 think that winter should be longer, and then summer is a bit shorter, and then the shortest one should be spring and autumn. Very uneven right? Let's see the other one, we saw some even distribution for the four seasons. Who's that, group 2, right? Groups 4 and 5 also think that the seasons should be even.
T: So, some groups think the seasons are uneven, whereas the other groups think oppositely. Let's check the answer together, by searching for something, ok, let's see here (the next activity).
At almost the end of the activity, a summary by the teacher was drawn based on the students' answers that "Some groups think seasons are uneven, while some groups think seasons are even." Instead of correcting the students' misconceptions of seasons by telling them whether their answers were right or wrong, the teacher guided them to the next activity, during which they explored more information about the weather characteristics of seasons. The analysis of these characteristics helped the students reflect upon their existing ideas of the distribution of the seasons and subsequently construct correct conceptions of the seasons by themselves.
Figure 2. The interface for the coloring game and the students' responsesConstructing conceptions of season distribution by analyzing the weather data
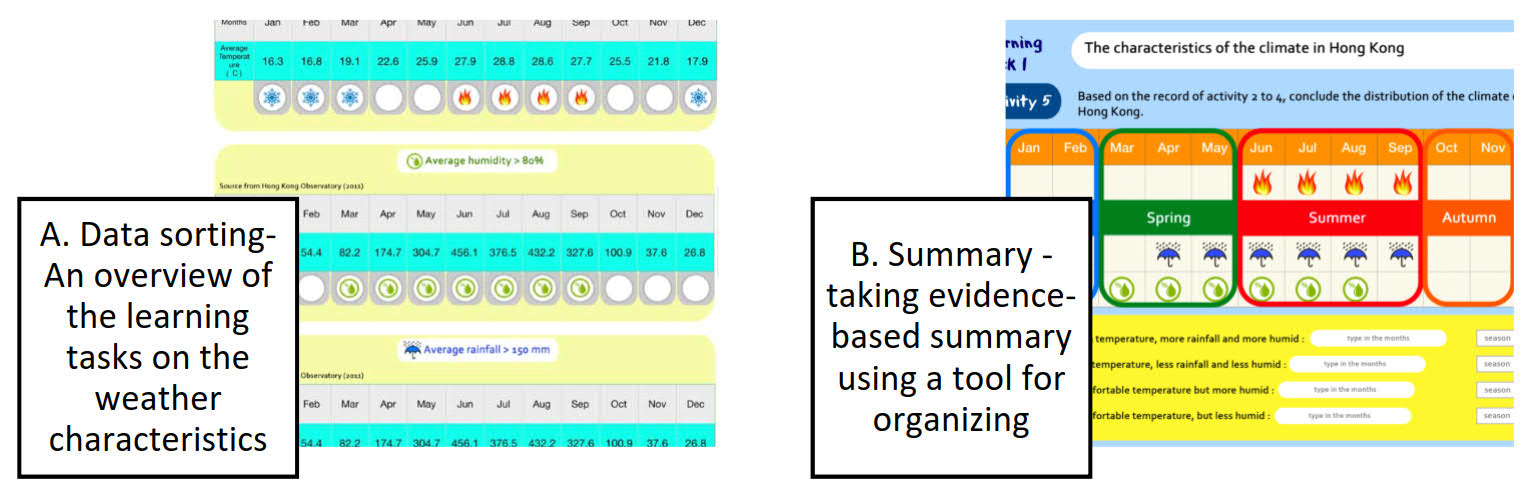
In the subsequent learning tasks, relevant weather data on the temperature, humidity, and rainfall of the 12 months extracted from the Hong Kong Observatory website are the resources to guide the inquiry learning. The software guidance, such as using a fire image to represent the months with average temperature higher than 27 degrees, using a water drop image to represent the months with average humidity higher than 80%, or using an umbrella image to represent the months with average rainfall higher than 250 mm, serve as scaffolds to guide the students to analyze the weather data to generalize the commonalities in temperature, humidity, and rainfall for each season.
According to the analysis of the lesson observation data, it was found that the students were encouraged to work cooperatively during this activity. Each member of each group was arranged to complete one task of this activity in turn. Specifically, after the first student finished the first task of categorizing months into different groups according to average temperature, the second student started to work on the second task of clarifying months with reference to average humidity, and then the third students focused on the third task of identifying months based on average rainfall (Figure 3).
After all three tasks were finished, a table which summarizes the students' answers was automatically generated by the e-learning system. This table enabled the students to re-access their answers, which offered them extended time for cognitive processing, and eventually contributed to their cognitive development. Based on the table and the text descriptions of temperature, rainfall, and humidity patterns below the table, the students were allowed time to respond to four fill-in-the-blank questions (as shown in Figure 3). This was followed with the whole-class discussion based on the students' responses. As shown in excerpt 3, the students and the teacher discussed the months which have high temperature, high rainfall, and high humidity. After analyzing the weather pattern of September, the students found that September is not humid, and should not be a summer month.
Excerpt 3
T: For high temperature, and then high rainfall, high humidity, how many months do we have?
S: June, July, August and September.
T: June, July, August and September. Any different answers from other group?
S: 3, but no September.
T: Yes, over 150 right? So high rainfall for September. Then how is humidity? Is it high humidity for September?
S: No
T: Yes, above 80% means higher than 80% which is not the same as 80%, so is the humidity above 80%?
S: No
T: September, is it correct?
S: No
T: So here, this one, June, July, August, which season you guess. Summer. Do you all agree?
S: Yes.
Excerpt 3 suggests that the process of analyzing the weather data of each month enabled the students to identify the months of each season, and to understand the reasons why seasons are distributed in this even way (e.g., the reason for Mar, April and May being spring is that these months are hot, humid, and have heavy rain) rather than the other way. Through such a process, the students might become aware of using evidence in making sound judgments regarding seasons and thereby develop skills of scientific explanations. As evident in the walkthroughs, all three students were able to explain season distribution by using the weather data related to temperature, rainfall, and humidity as evidence, rather than personal daily experiences. Overall, the e-learning activities contributed to the students' knowledge construction about seasons.
Figure 3. The interface for the data sorting and analyzing game
![]()
![]()
![]()
Copyright (C) 2018 EdUHK APFSLT. Volume 19, Issue 2, Article 9 (Dec., 2018). All Rights Reserved.