 |
Asia-Pacific Forum on Science Learning and Teaching, Volume 19, Issue 2, Article 1 (Dec., 2018) |
Exploratory Factor Analysis for Environmental Factors
For environmental factors, a total of 34 items were identified. These 34 items were subjected to principal component analysis (PCA) using SPSS version 23. Prior to performing PCA, the suitability of data for factor analysis was assessed. Inspection of the correlation matrix revealed the presence of many coefficients of .3 and above. The Kaiser-Meyer-Olkin value was .915, exceeding the recommended value of .6 (Pallant, 2011) and the Bartlett's test of sphericity reached a statistical significance, supporting the factorability of the correlation matrix as shown in Table 3.
Table 3. The Findings from Kaiser-Meyer-Olkin and Bartlett's Test for Environmental Factors
Kaiser-Meyer-Olkin's Measure of Sampling Adequacy
.915
Bartlett's Test of Sphericity
Approx. Chi-Square
5729.671
Df
561
Sig.
.000
Principal component analysis revealed the presence of seven components with eigenvalues exceeding 1. An inspection of the scree plot revealed a clear break after the fourth component as shown in Figure 1. Thus, the decision was made to retain these four components for further investigation.
Figure 1. Scree Plot for Environmental Factors
To aid the interpretation of the four components, varimax rotation was used to generate orthogonal factors. The four components' solution explained a total of 49.70% of the variance, with component 1 contributing 19.57%, component 2 contributing 12.08%, component 3 contributing 10.31 %, and component 4 contributing 7.72%, as shown in Table 4.
Table 4. Total Variance Explained for Environmental Factors
Initial Eigenvalues
Extraction Sums of Squared Loadings
Rotation Sums of Squared Loadings
Total
% of Variance
Cumulative %
Total
% of Variance
Cumulative %
Total
% of Variance
Cumulative %
1
10.604
31.188
31.188
10.604
31.188
31.188
6.656
19.576
19.576
2
2.819
8.291
39.479
2.819
8.291
39.479
4.109
12.085
31.661
3
1.917
5.639
45.117
1.917
5.639
45.117
3.508
10.318
41.979
4
1.558
4.583
49.700
1.558
4.583
49.700
2.625
7.721
49.700
Table 5. Rotated Component Matrix for Environmental Factors
Component
Media influences
Activities outside the classroom
Social influences
Activities in the classroom
d7
.825
d4
.819
d1
.801
d3
.795
d6
.782
d5
.780
d8
.732
d2
.713
d10
.622
d9
.566
b12
.728
b13
.710
b8
.681
b10
.656
b9
.626
b11
.595
b7
.489
b1
.459
c3
.592
c5
.552
c6
.546
c11
.512
c9
.510
c8
.507
c1
.506
c2
.495
c7
.491
c10
.472
c4
.430
b3
.775
b2
.720
b4
.645
b5
.601
b6
Based on factor loading values as shown in Table 5, item b6 was removed because of low factor loading whereas item b1 was categorized into another group. We decided to retain item b1 in the outside of classroom activity component. We believe that students are highly likely to conduct design activities outside the classroom and not in the classroom as shown in earlier studies. Overall, based on exploratory factor analysis, environmental factors consist of four sub factors i.e., activities in the classroom (component 4), activities outside the classroom (component 2), social influences (component 3), and media influences (component 1).
Exploratory Factor Analysis for STEM Self-Efficacy
20 items were developed for self-efficacy. These 20 items were subjected to principal component analysis (PCA) using SPSS version 23. Inspection of the correlation matrix revealed the presence of many coefficients of .3 and above and the Kaiser-Meyer-Olkin value was .881, exceeding the recommended value of .6 (Pallant, 2011) and the Bartlett's test of sphericity reached a statistical significance, supporting the factorability of the correlation matrix as shown in Table 6.
Table 6. Findings from Kaiser-Meyer-Olkin and Bartlett's Test for Self-Efficacy
Kaiser-Meyer-Olkin Measure of Sampling Adequacy
.881
Bartlett's Test of Sphericity
Approx. Chi-Square
4192.599
Df
190
Sig.
.000
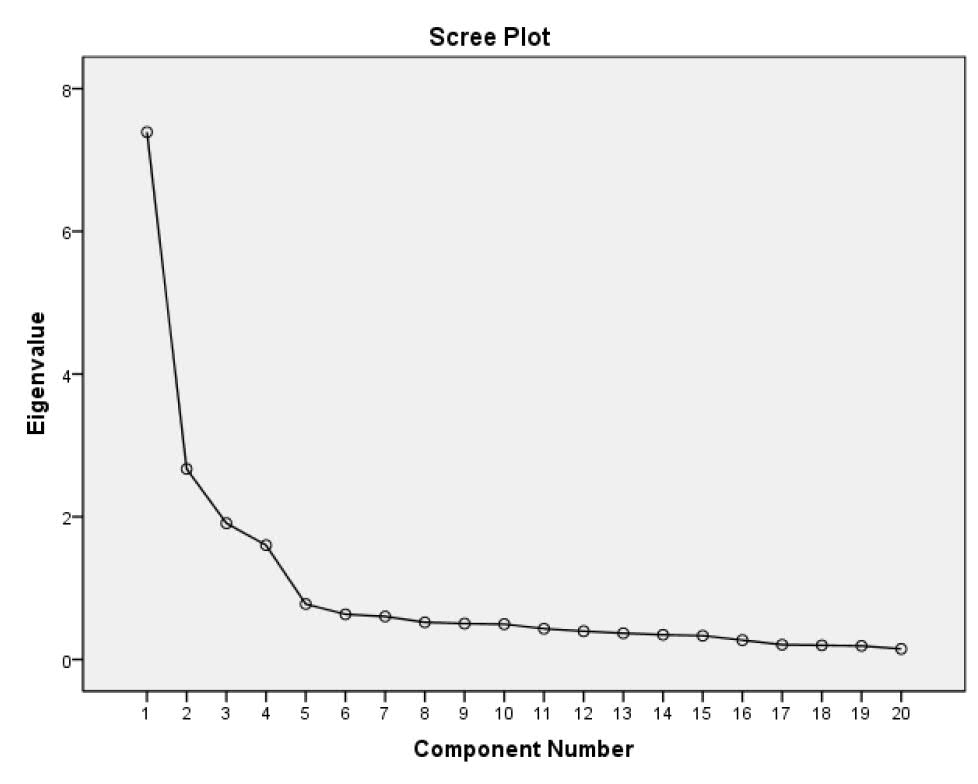
Principal component analysis revealed the presence of four components with eigenvalues exceeding 1. An inspection of the scree plot revealed a clear break after the fourth component as shown in Figure 2.
Figure 2. Scree Plot for Self-Efficacy
Varimax rotation was selected because the factors in self-efficacy were determined according to STEM fields. The four components' solution explained a total of 67.86% of the variance, with component 1 contributing 18.05%, component 2 contributing 17.14%, component 3 contributing 16.64%, and component 4 contributing 16.04 %, as shown in Table 7.
Table 7. Total Variance Explained for Self-Efficacy
Initial Eigenvalues
Extraction Sums of Squared Loadings
Rotation Sums of Squared Loadings
Total
% of Variance
Cumulative %
Total
% of Variance
Cumulative %
Total
% of Variance
Cumulative %
1
7.390
36.952
36.952
7.390
36.952
36.952
3.609
18.046
18.046
2
2.671
13.353
50.305
2.671
13.353
50.305
3.429
17.144
35.190
3
1.910
9.552
59.858
1.910
9.552
59.858
3.329
16.643
51.833
4
1.602
8.010
67.868
1.602
8.010
67.868
3.207
16.035
67.868
Based on the factor loading values in the rotated component matrix as shown in Table 8, all the 20 items belonged to the four elements, namely i) Science (e1 to e5), ii) Technology (e6 to e10), iii) Engineering (e11 to e15), and iv) Mathematics (e16 to e20).
Table 8. Rotated Component Matrix for Self-Efficacy
Component
Science
Mathematics
Engineering
Technology
e4
.851
e2
.811
e3
.807
e1
.721
e5
.693
e20
.869
e16
.842
e17
.766
e19
.743
e18
.646
e13
.816
e14
.805
e15
.750
e12
.746
e11
.668
e8
.818
e9
.812
e6
.792
e10
.748
e7
.722
Exploratory Factor Analysis for Perception of STEM Careers
14 items were developed for perception of STEM careers. These 14 items were subjected to principal component analysis (PCA). Prior to performing PCA, the suitability of data for factor analysis was assessed. Inspection of the correlation matrix revealed the presence of many coefficients of .3 and above. The Kaiser-Meyer-Olkin value was .880, exceeding the recommended value of .6 (Pallant, 2011) and the Bartlett's test of sphericity reached a statistical significance, supporting the factorability of the correlation matrix as shown in Table 9.
Table 9. Findings from Kaiser-Meyer-Olkin and Bartlett's Test for Perception of STEM Careers
Kaiser-Meyer-Olkin Measure of Sampling Adequacy
.880
Bartlett's Test of Sphericity
Approx. Chi-Square
2533.864
Df
91
Sig.
.000
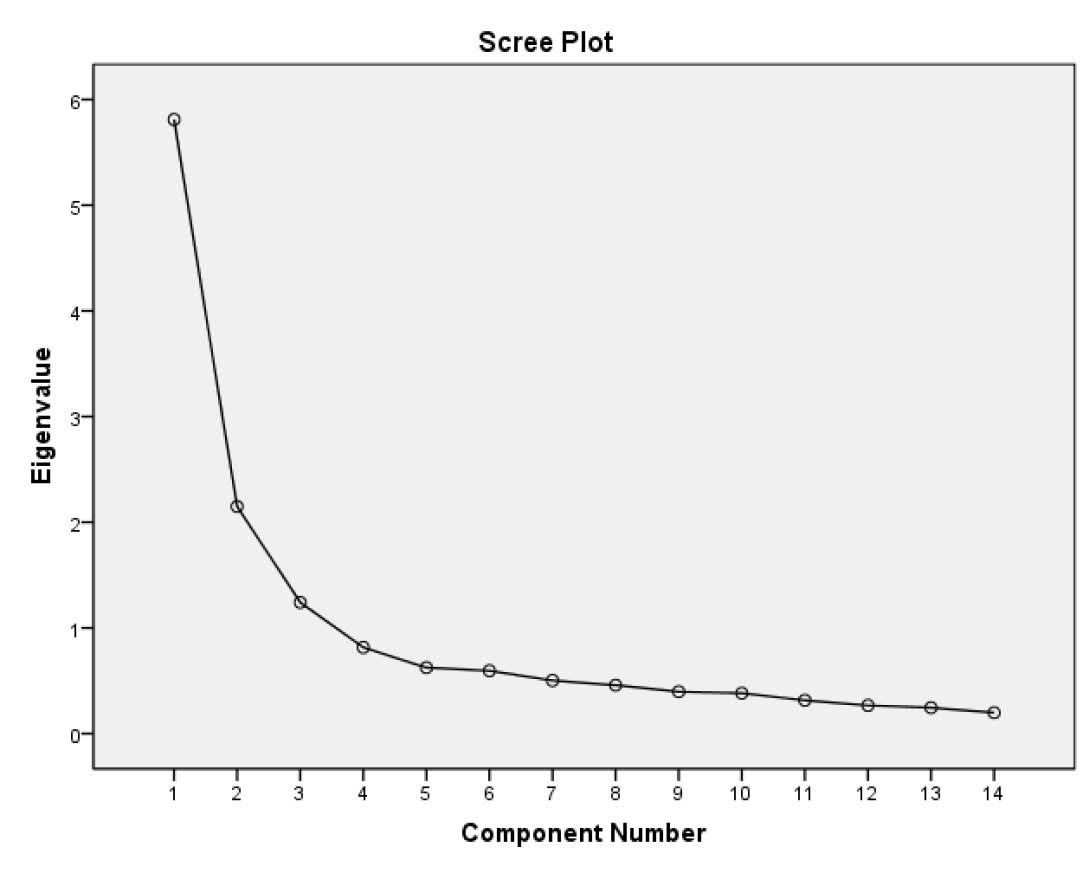
Initially, principal component analysis revealed the presence of three components with eigenvalues exceeding 1. An inspection of the scree plot revealed a clear break after the thirdcomponent as shown in Figure 2.
Figure 3. Scree Plot for Perception of STEM Careers
However, we decided to keep to two components as determined earlier using varimax rotation. The two solutions explained a total of 56.86% of the variance, with component 1 contributing 30.03% and component 2 contributing 26.83 %, as shown in Table 10.
Table 10. Total Variance Explained for Perception of STEM Careers
Initial Eigenvalues
Extraction Sums of Squared Loadings
Rotation Sums of Squared Loadings
Total
% of Variance
Cumulative %
Total
% of Variance
Cumulative %
Total
% of Variance
Cumulative %
1
5.811
41.506
41.506
5.811
41.506
41.506
4.204
30.029
30.029
2
2.149
15.350
56.856
2.149
15.350
56.856
3.756
26.827
56.856
Based on the factor loading values in the rotated component matrix as shown in Table 8, all the 14 items belonged to the two components as was decided earlier in this study. Table 11 shows the rotated component matrix for perception of STEM careers belong into two sub factors i.e., job prospect in STEM careers and skills needed in STEM careers.
Table 11. Rotated Component Matrix for Perception of STEM Careers
Job Prospect
Skills Needed
f2
.774
f6
.766
f3
.749
f4
.740
f1
.736
f5
.620
f8
.612
f7
.453
f10
.858
f11
.856
f12
.844
f13
.763
f14
.638
f9
.515
Exploratory Factor Analysis for Interest in STEM Careers
12 items were developed for interest in STEM careers. These 12 items were subjected to principal component analysis (PCA). Prior to performing PCA, the suitability of data for factor analysis was assessed. Inspection of the correlation matrix revealed the presence of many coefficients of .3 and above. The Kaiser-Meyer-Olkin value was .875, exceeding the recommended value of .6 (Pallant, 2011) and the Bartlett's test of sphericity reached a statistical significance, supporting the factorability of the correlation matrix as shown in Table 12.
Table 12. Findings from Kaiser-Meyer-Olkin and Bartlett's Test for Interest in STEM Careers
Kaiser-Meyer-Olkin Measure of Sampling Adequacy
.875
Bartlett's Test of Sphericity
Approx. Chi-Square
1439.306
Df
66
Sig.
.000
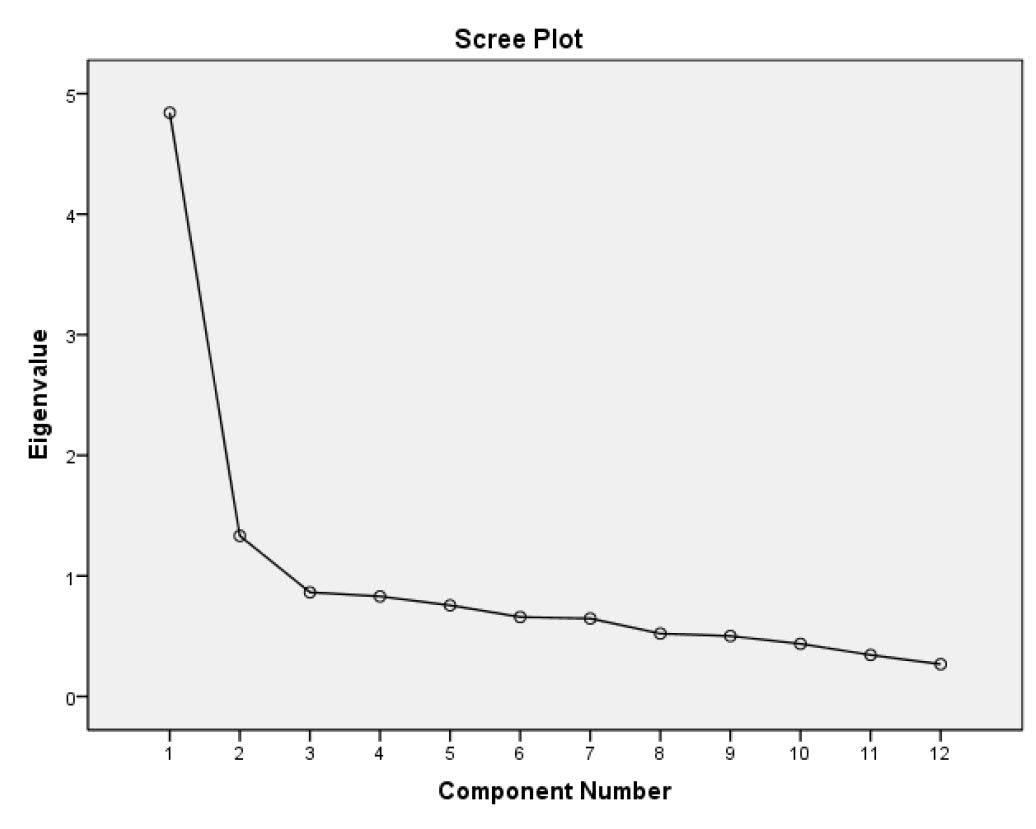
Initially, principal component analysis revealed the presence of two components with eigenvalues exceeding 1. An inspection of the scree plot revealed a clear break after the two components as shown in Figure 2.
Figure 4. Scree Plot for Interest in STEM Careers
To aid interpretation of the two components, varimax rotation was performed. The two solutions explained a total of 51.450% of the variance, with component 1 contributing 25.749% and component 2 contributing 25.701%, as shown in Table 13.
Table 13. Total Variance Explained for Interest in STEM Careers
Initial Eigenvalues
Extraction Sums of Squared Loadings
Rotation Sums of Squared Loadings
Total
% of Variance
Cumulative %
Total
% of Variance
Cumulative %
Total
% of Variance
Cumulative %
1
4.842
40.348
40.348
4.842
40.348
40.348
3.090
25.749
25.749
2
1.332
11.102
51.450
1.332
11.102
51.450
3.084
25.701
51.450
Based on the factor loading values in the rotated component matrix as shown in Table 14, all the 12 items belonged to the two components i.e., physical sciences and life sciences. Physical sciences are items/work related to physics, mathematics, computer sciences, energy, engineering and entrepreneur or business scientist careers. In contrast, careers in life sciences consist of jobs related to environmental works, biology and zoology, earth science, medical science, chemistry and science teachers or educators.
Table 14. Rotated Component Matrix for Interest in STEM Careers
Component
Life Sciences
Physical Sciences
g7
.821
g3
.777
g8
.656
g5
.609
g2
.536
g12
.494
g10
.832
g9
.805
g6
.634
g1
.571
g11
.547
g4
.424
Overall, the Cronbach's alpha value for each factor was between .817 and .933. Thus, each value indicated that all items showed high reliability as shown is Table 15.
Table 15. Cronbach's Alpha Value
No.
Construct
Element
Cronbach's Alpha Value
1
Learning experiences
In the classroom
.704
Outside the classroom
.833
2
Social influences
-
.817
3
Media influences
-
.933
4
Self-efficacy
Science
.892
Technology
.849
Engineering
.856
Mathematics
.897
5
Perception of STEM careers
Job prospect
.858
Skills needed in STEM career
.873
6
Interest in STEM careers
.863
Interpretation of Total Score Mean
The level for each factor was interpreted through the total score mean value and categorized as shown in Table 16. The total score mean interpretation was adapted from Nunnally (1997) where scores are indicated as low, medium low, medium high and high based on the total score mean obtained.
Table 16. Mean Value and Interpretation of Total Score Mean
Total Score Mean
Interpretation of Total Score Mean
1.00 - 2.50
2.51 - 5.00
5.01 - 7.50
7.51 - 10.00
Low
Medium Low
Medium High
High
(Adapted from Nunnally, 1997)

![]()
![]()
![]()
Copyright (C) 2018 EdUHK APFSLT. Volume 19, Issue 2, Article 1 (Dec., 2018). All Rights Reserved.