|
Asia-Pacific Forum on Science Learning and Teaching, Volume 19, Issue 2, Article 16 (Dec., 2018) |
The research question and associated null hypothesis were as follows:
Research Question: What are the differences in achievement between students taught using the GIL approach and those taught traditionally?
The associated null hypothesis was:
H0: The GIL approach, as opposed to the traditional approach used for teaching the introductory programming course for entry-level students at HEIs, has no effect on their course achievements.
Quantitative and qualitative results of the analysis of the data gathered to address the above-mentioned research question and null hypothesis are given in this section.
These are the findings obtained after an analysis of all the assessments that were given to the learners. The data included marks for the formative assessments - test one, two, three and four. These marks were computed to form the year mark (DP) for examination admission; then there was the summative assessment – examination marks. The final mark was computed as follows: Both year mark and examination mark had to have a sub-minimum of 40%. If a student failed to achieve these separate sub-minimum marks, then he/she failed the course. The final mark was computed by taking 40% of the year mark and 60% of the examination mark. At the end of the course, using this formula, the overall final marks of the students were also calculated. The quantitative data for the study was based on the marks that were captured from the experimental and control groups. (sample questions from all these assessments are given in Appendix 1).
Chi-Square test analysis and bar charts for assessments
Formative assessment 1 (Test 1) was conducted towards the end of first term (first quarter) of the academic year. The same assessment was used for both the experimental and control groups. The analysis of Test 1 results was as follows:
Table 1. Formative assessment 1 (Test 1) Chi-square on Pass rates on two groups
Chi-Square Tests
Value
df
Asymptotic Significance (2-sided)
Exact Sig. (2-sided)
Exact Sig. (1-sided)
Pearson Chi-Square
2.859a
1
.091
Continuity Correctionb
1.338
1
.247
Likelihood Ratio
4.267
1
.039
Fisher's Exact Test
.142
.122
Linear-by-Linear Association
2.799
1
.094
N of Valid Cases
48
a. 2 cells (50.0%) expected a count of less than 5. The minimum expected count was 1.58.
b. Computed only for a 2 x 2 table
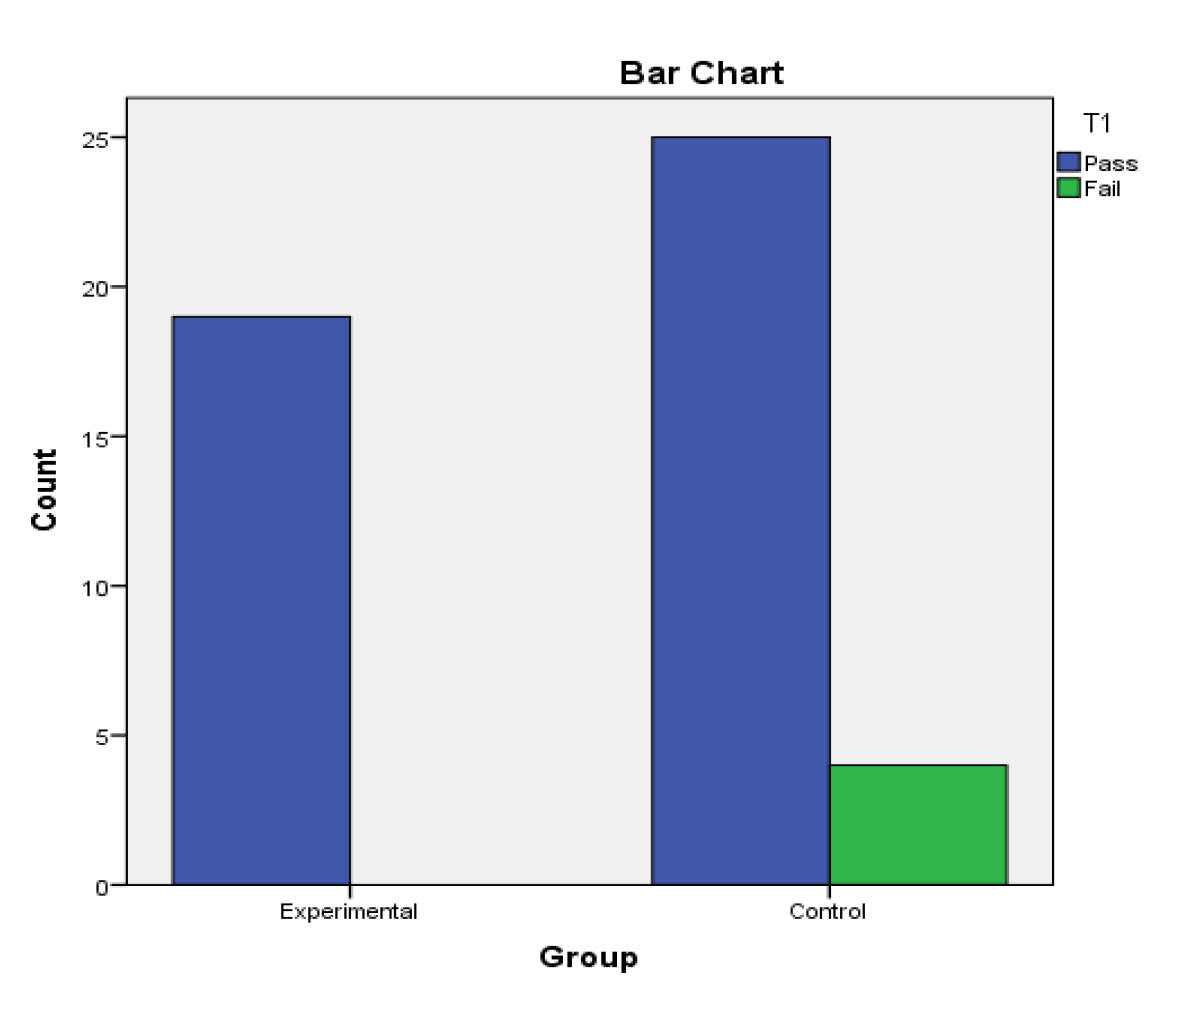
Figure 1. Formative assessment 1 (Test 1) performance for each group.
The value of the test statistic was2.859. Since the p-value (p=0.091) is greater than our chosen significance level (α = 0.05), we do not reject the null hypothesis. Rather, we conclude that there is not enough evidence to suggest an association between group (teaching methods) and whether a student passes or fails. Based on the results, we can state the following:
No association was found between groups (teaching methods) and whether or not students passed or failed (chi-square = 2.859, p = 0.091). All students (100%) from experimental group, however, passed test-1 as compared to twenty-five (86.2%) from the control group.
Formative assessment 2 (Test 2) was conducted towards the end of the second term (second quarter) of the academic year. The same assessment was used for both the experimental and control groups. The analysis of Test 2 results was follows:
Table 2. Formative assessment 2 (Test 2) chi-square on pass rates on two groups
Chi-Square Tests
Value
df
Asymptotic Significance
(2-sided)Exact Sig. (2-sided)
Exact Sig. (1-sided)
Pearson Chi-Square
18.929a
1
.000
Continuity Correctionb
16.429
1
.000
Likelihood Ratio
22.031
1
.000
Fisher's Exact Test
.000
.000
Linear-by-Linear Association
18.534
1
.000
N of Valid Cases
48
a. 0 cells (0.0%) expected a count of less than 5. The minimum expected count was 8.31.
b. Computed only for a 2 x 2 table
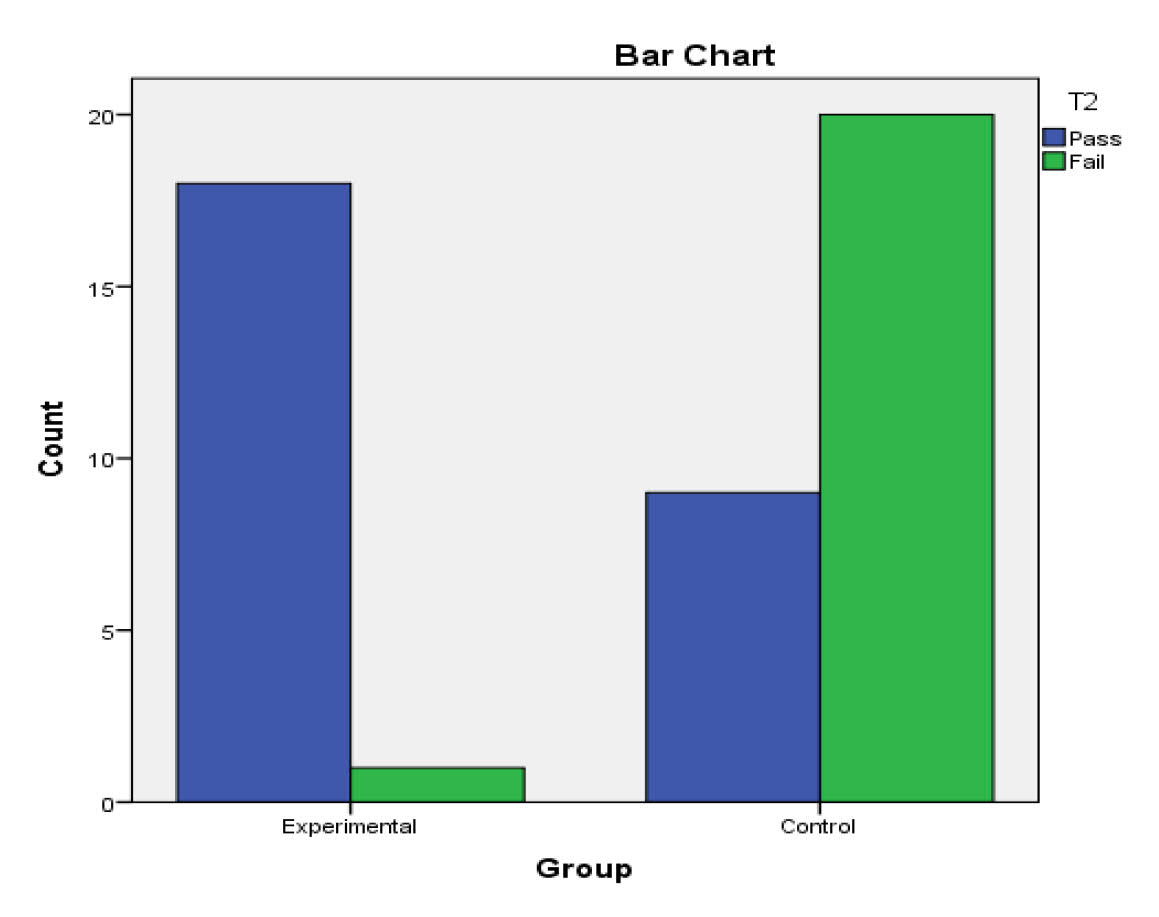
Figure 2. Formative assessment 2 (Test 2) performance for each group.
The value of the test statistic was 18.929. Since the p-value (p=0.000) is less than our chosen significance level α = 0.05, we can reject the null hypothesis, and conclude that there is an association between groups (teaching methods) and whether or not students pass or fail. Based on the results, we can state the following:
There was a significant association between groups and whether or not students passed or failed (chi-square = 18.929, p =0 .000). Eighteen students (94.7%) from the experimental group passed the tests as compared to only nine (31.0%) students from the control group. The very high failure rate in the control group contributed significantly to the overall drop of about 35% in the pass rate for test-2 as compared to test-1.
The formative assessment 3 (Test 3) was conducted towards the end of the third term (third quarter) of the academic year. The same assessment was used for both the experimental and control groups. The analysis of Test 3 results was as follows:
Table 3. Formative assessment 3 (Test 3) chi-square on pass rates on two groups
Chi-Square Tests
Value
Df
Asymptotic Significance (2-sided)
Exact Sig. (2-sided)
Exact Sig. (1-sided)
Pearson Chi-Square
3.499a
1
.061
Continuity Correctionb
2.409
1
.121
Likelihood Ratio
3.714
1
.054
Fisher's Exact Test
.110
.058
Linear-by-Linear Association
3.426
1
.064
N of Valid Cases
48
a. 0 cells (0.0%) expected a count of less than 5. The minimum expected count was 5.94.
b. Computed only for a 2 x 2 table
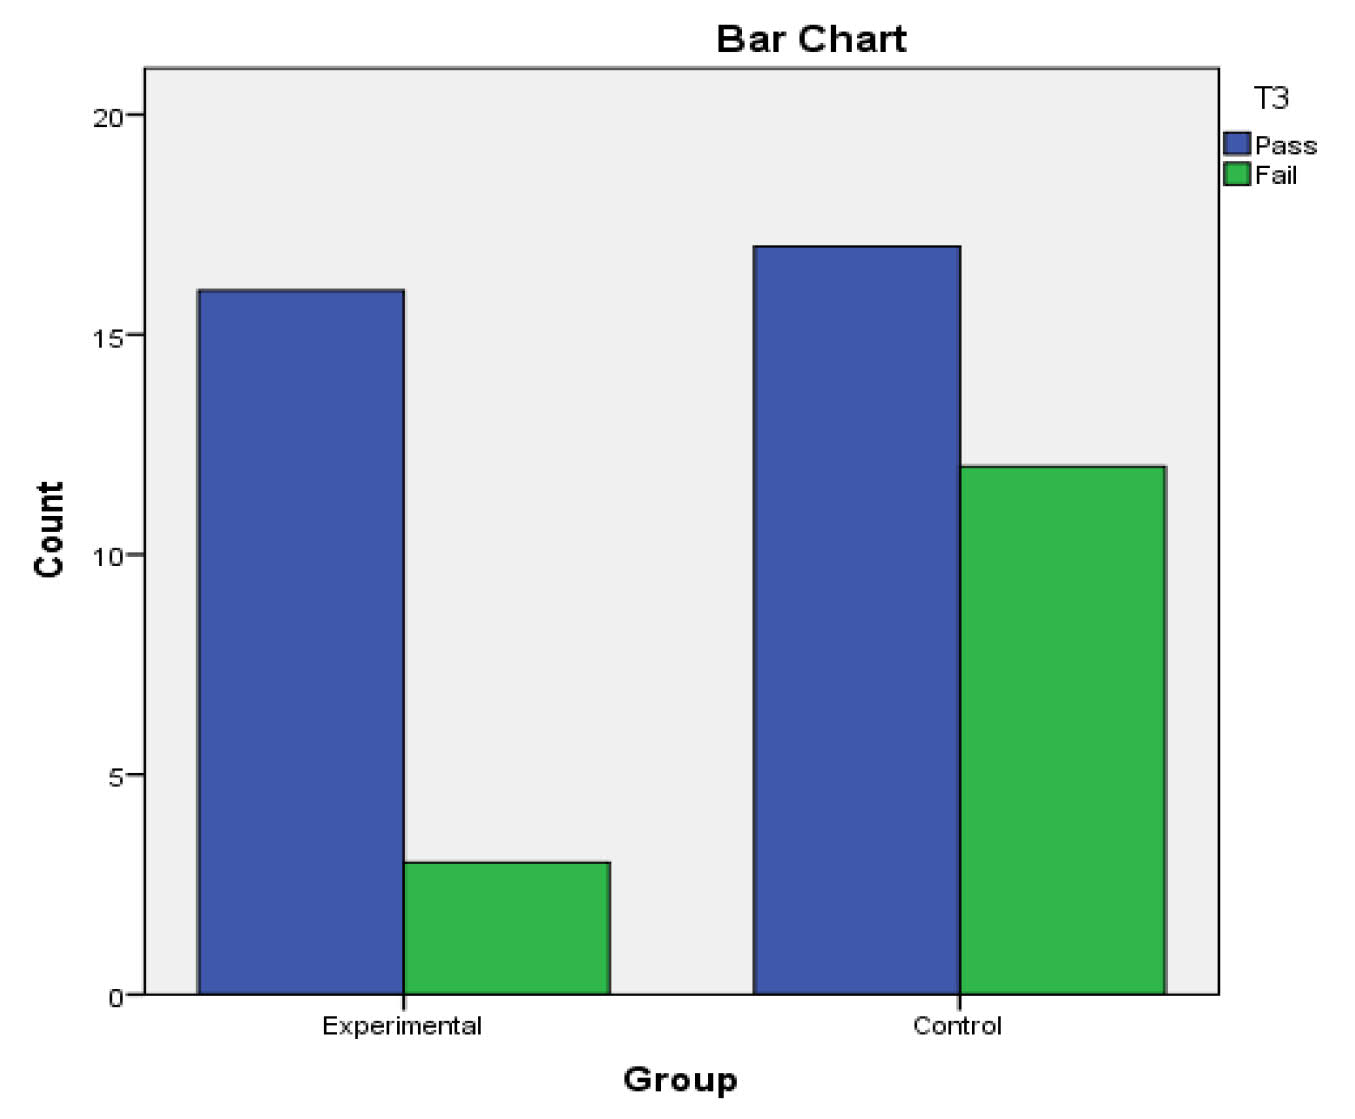
Figure 3. Formative assessment 3 (Test 3) performance for each groups.
The value of the test statistic is 3.499. Since the p-value (p=0.061) is greater than our chosen significance level (α = 0.05), we do not reject the null hypothesis. Rather, we conclude that there is not enough evidence to suggest an association between groups (teaching methods) and whether a student passed or failed. Based on the results, we can state the following:
No association was found between groups (teaching methods) and whether or not students passed or failed (chi-square = 3.499, p = 0.061). Sixteen students (84.2%) from experimental group, however, passed test-3 as compared to only 17 (58.6%) from the control group.
The formative assessment 4 (Test 4) was conducted in the fourth term (fourth quarter) of the academic year. Same assessment was used for both the experimental and control. The analysis of Test 4 results was as follows:
Table 4. Formative assessment 4 (Test 4) chi-square on pass rates on two groups
Chi-Square Tests
Value
Df
Asymptotic Significance (2-sided)
Exact Sig. (2-sided)
Exact Sig. (1-sided)
Pearson Chi-Square
9.885a
1
.002
Continuity Correctionb
7.984
1
.005
Likelihood Ratio
11.621
1
.001
Fisher's Exact Test
.002
.001
Linear-by-Linear Association
9.679
1
.002
N of Valid Cases
48
a. 0 cells (0.0%) expected a count of less than 5. The minimum expected count was 5.94.
b. Computed only for a 2 x 2 table
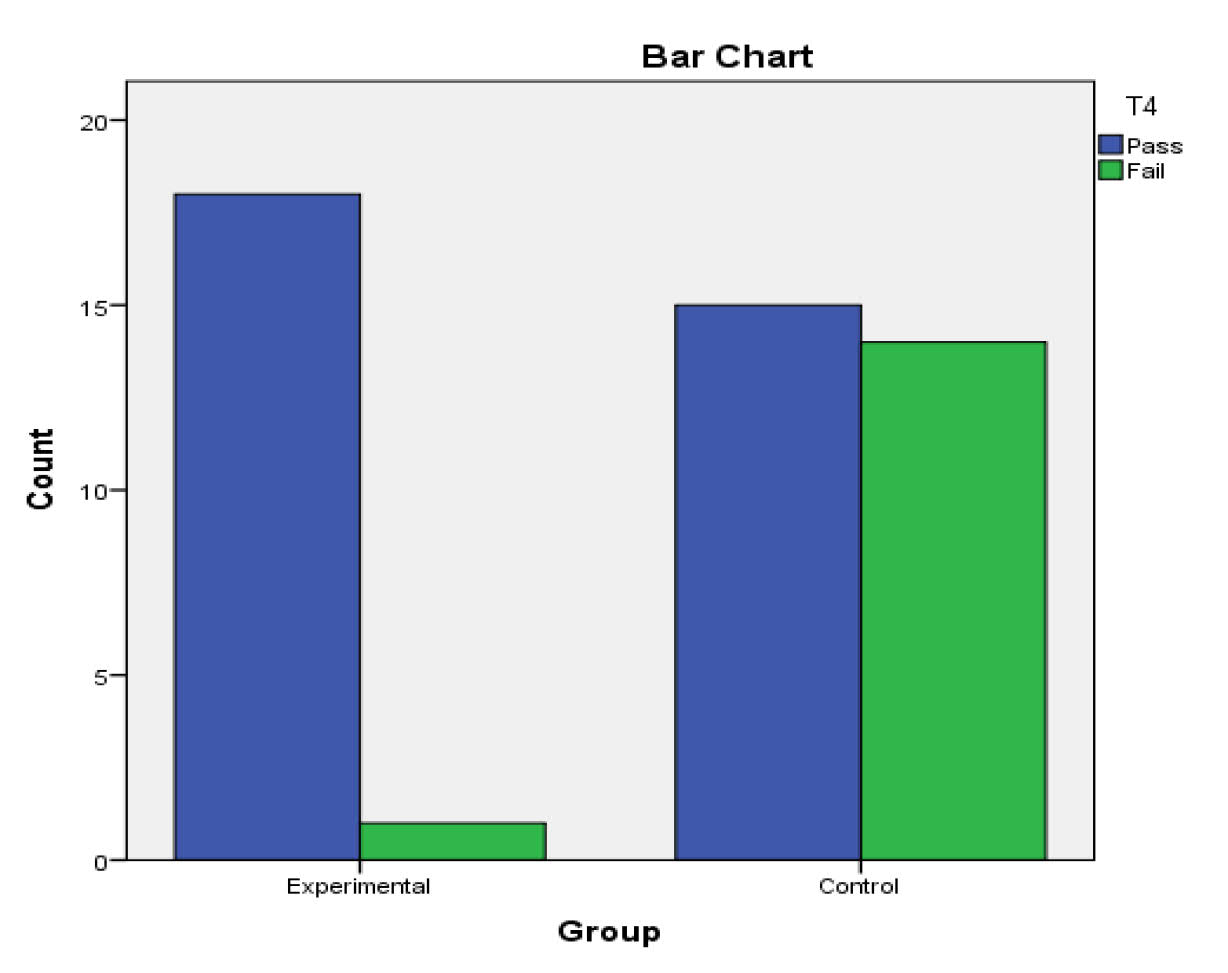
Figure 4. Formative assessment 4 (Test 4) performance for each groups.
The value of the test statistic is 9.885. Since the p-value (p=0.002) is less than our chosen significance level α = 0.05, we can reject the null hypothesis, and conclude that there is an association between groups (teaching methods) and whether or not students passed or failed. Based on the results, we can state the following:
There was a significant association between the groups and whether or not students passed or failed (chi-square = 9.885, p =0 .002). Eighteen students (94.7%) from the experimental group passed the tests as compared to only 15 (51.7%) students from the control group.
The average marks scored in these four tests constituted the year mark (DP) for students.
Table 5. Admission to Examinations (DP) Chi-square on two groups
Chi-Square Tests
Value
df
Asymptotic Significance (2-sided)
Exact Sig. (2-sided)
Exact Sig. (1-sided)
Pearson Chi-Square
10.483a
1
.001
Continuity Correctionb
8.392
1
.004
Likelihood Ratio
14.648
1
.000
Fisher's Exact Test
.001
.001
Linear-by-Linear Association
10.264
1
.001
N of Valid Cases
48
a. 1 cells (25.0%) expected a count of less than 5. The minimum expected count was 4.75.
b. Computed only for a 2 x 2 table
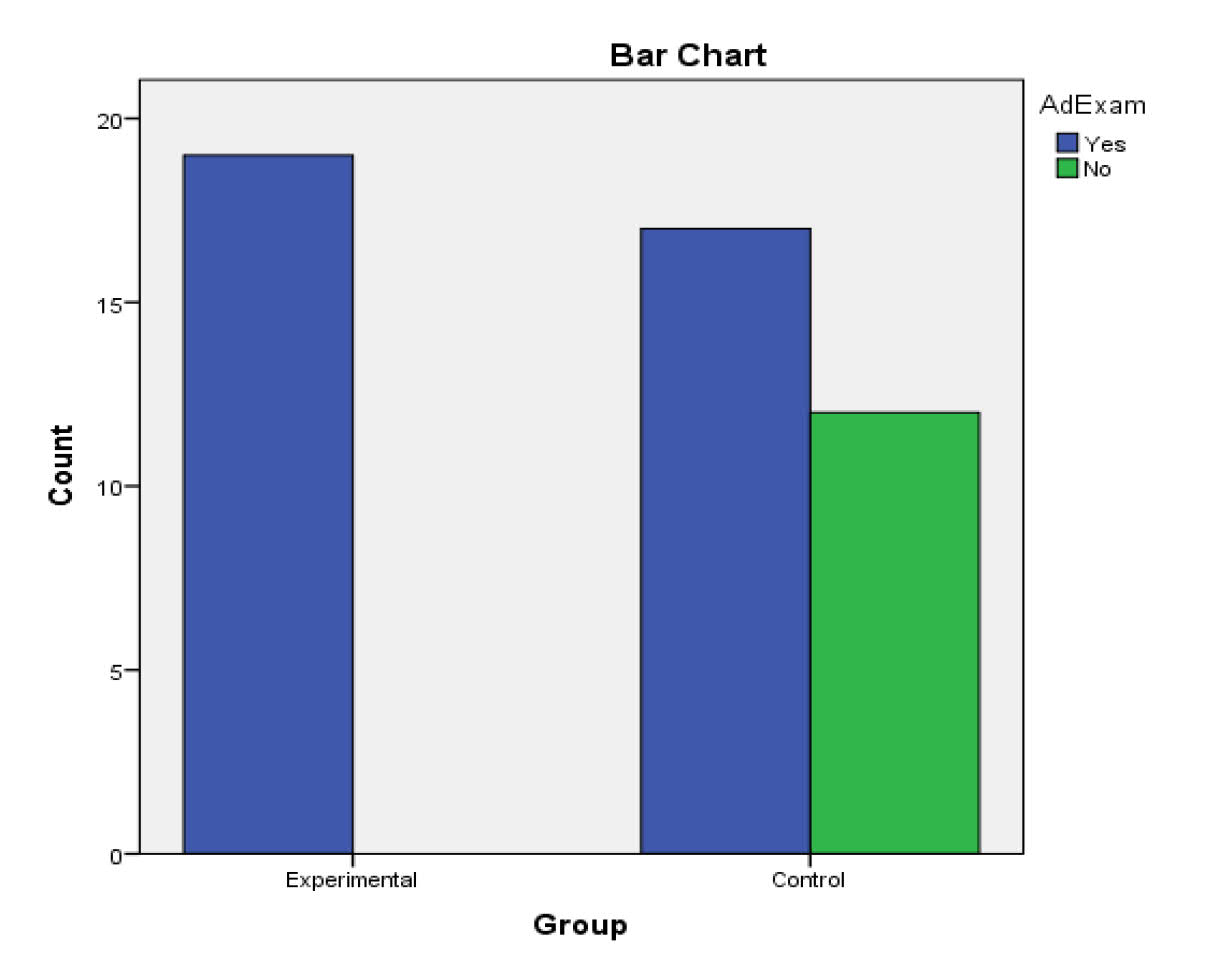
Figure 5. Admission to examination (DP) for each group.
The value of the test statistic is 10.483. Since the p-value (p=0.001) is less than our chosen significance level α = 0.05, we can reject the null hypothesis, and conclude that there is an association between group (teaching methods) and whether or not students pass or fail. Based on the results, we can state the following:
There was a significant association between groups and whether or not students passed or failed (chi-square = 10.483, p =0 .001). All students (100%) from the experimental group qualified for the final examination based on their performances throughout the academic year while only 17 (58.6%) of the students from the control group, which was taught using a traditional approach, managed to qualify for the final examination. From the control group, a staggering percentage (41.4%) could not even qualify for the final examination.
Analysis of final course results are given below:
Table 6. Final results chi-square on two groups
Chi-Square Tests
Value
df
Asymptotic Significance (2-sided)
Exact Sig. (2-sided)
Exact Sig. (1-sided)
Pearson Chi-Square
7.361a
1
.007
Continuity Correctionb
5.760
1
.016
Likelihood Ratio
8.150
1
.004
Fisher's Exact Test
.011
.007
Linear-by-Linear Association
7.208
1
.007
N of Valid Cases
48
a. 0 cells (0.0%) expected a count of less than 5. The minimum expected count was 6.33.
b. Computed only for a 2 x 2 table
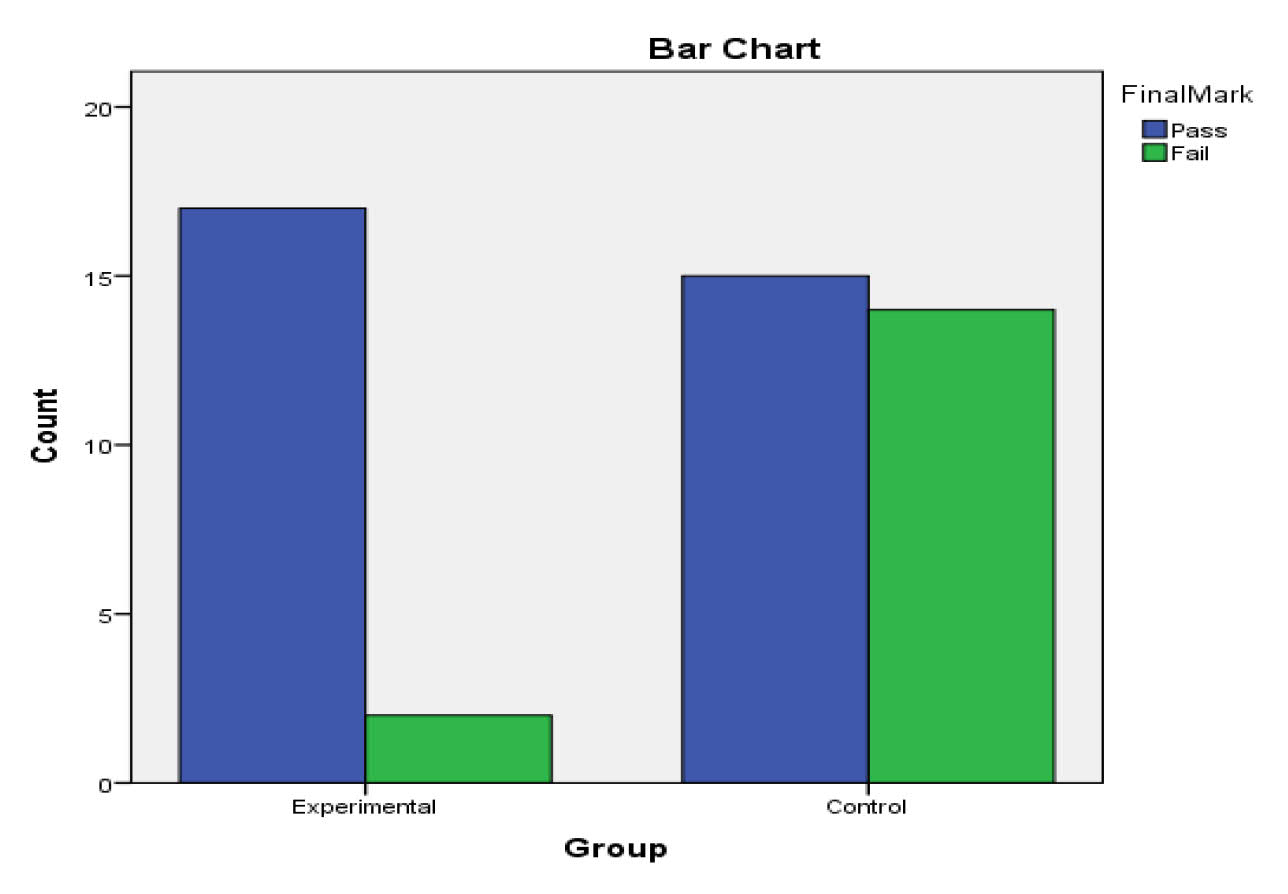
Figure 6. Final Results (Overall Pass/Fail) for each group.
The value of the test statistic is 7.361. Since the p-value (p=0.007) is less than our chosen significance level α = 0.05, we can reject the null hypothesis and conclude that there is an association between group (teaching methods) and whether or not students pass or fail. Based on the results, we can state the following:
There was a significant association between groups and whether or not students passed or failed (chi-square = 7.361, p =0 .007). Only two students (10.5%) failed to complete the course successfully from the experimental group as compared to fourteen (48.3%) students from the control group. Nearly all of the students (90%) learning through the GIL approach completed the course successfully as compared to almost 52% of students taught using the traditional teaching approach completed it.
Overall summary of tests and average marks
Table 7. Summary of tests and average mark- Group Statistics
Group Statistics
Group
N
Mean
Std. Deviation
Std. Error Mean
Test1
Experimental
19
65.39
6.680
1.533
Control
29
63.97
15.729
2.921
Test2
Experimental
19
57.37
16.480
3.781
Control
29
34.07
25.386
4.714
Test3
Experimental
19
56.21
16.301
3.740
Control
29
46.34
29.472
5.473
Test4
Experimental
19
58.32
16.101
3.694
Control
29
33.79
22.132
4.110
DP
Experimental
19
59.53
11.187
2.567
Control
29
45.10
20.106
3.734
t-test analysis for assessments
Table 8. Calculated t-test results for all assessments – The Independent Samples Test
Independent Samples Test
Levene's Test for Equality of Variances
t-test for Equality of Means
F
Sig.
t
df
Sig. (2-tailed)
Mean Difference
Std. Error Difference
95% Confidence Interval of the Difference
Lower
Upper
Test1
Equal variances assumed
13.292
.001
.374
46
.710
1.429
3.826
-6.272
9.131
Equal variances not assumed
.433
40.737
.667
1.429
3.298
-5.233
8.092
Test2
Equal variances assumed
2.117
.152
3.536
46
.001
23.299
6.590
10.034
36.565
Equal variances not assumed
3.856
46.000
.000
23.299
6.043
11.136
35.463
Test3
Equal variances assumed
11.758
.001
1.329
46
.190
9.866
7.424
-5.078
24.810
Equal variances not assumed
1.488
44.994
.144
9.866
6.629
-3.485
23.216
Test4
Equal variances assumed
4.185
.047
4.156
46
.000
24.523
5.900
12.647
36.399
Equal variances not assumed
4.438
45.412
.000
24.523
5.526
13.396
35.649
DP
Equal variances assumed
10.642
.002
2.845
46
.007
14.423
5.070
4.218
24.628
Equal variances not assumed
3.183
45.062
.003
14.423
4.531
5.298
23.548
The assessments highlighted in yellow show there was a statistically-confirmed significance between the GIL and the traditional approach among the two groups. Table VII depicts an independent-samples test which compared the means between the experimental and control students' performance in tests and DP. Levene's test for homogeneity of variance (homoscedasticity) was used.
The summary of the t-test results shows the significance of GIL (as shown in Table VII). This test verified that the assumption of equal variances holds in Test 2 and does not hold in the other samples. Significant differences in means between the groups were noticed in Test 2 (p=0.001), Test 4 (p=0.000) and DP (p=0.003).
On average, students' performance was not significantly different in test one and three. However, student performance was significantly different in test two and four. Even though the performances were not significantly different, the average Test one mark shows that students taught using GIL performed slightly better (65.30) than the control group (63.97). Similarly, the Test three average mark shows that the experiment group performed better on average (56.21) than the control group (46.34). Even though Test one and three's average mark is not significantly different for both groups, it is encouraging to note that the standard deviation for the experiment group was small (6.68) compared to that of the control group (15.73) for test one. Though slightly greater, the standard deviation of the experimental group (16.30) in test three was close to half that of the control group (29.47). This implies that, while both groups performed well, especially in test one, GIL closely and collectively improved the performance of all the students when compared to those exposed to the traditional teaching approach. Table VIII shows the details of the marks.
In addition, findings from test two and four show that the experimental group performed significantly better than the control group; for example, the average Test two marks for the experimental group was 57.4 compared to that of the control group which was 34.07. Similarly, Test four showed a significantly high average mark for the experimental group (58.32) compared to that of the control group (33.79). For Test 1 and 3, there was no significant difference as per the p-values, though the average for these two tests was still higher for the experimental group. It should however, be noted that the standard deviation was always lower for the experimental group than the control group (ref. Table 4.3). The lower standard deviation implies that the experimental group was generally performing at the same level. As was the case with Test one and three, the experimental group's standard deviation for Test two was smaller (16.48) when compared to that of the control group (25.39). A similar type of result was found on Test four as the experimental group had a smaller standard deviation of 16.10 compared to that of the control group that was 22.13. There were no common outliers and the mark differences for the assessments among the experimental groups were almost in the same range. The researchers maintain their argument that GIL collectively improves the performance of students with minimum outliers as students help each other understand the subject during the learning process. This argument is supported by the number of students who failed in class tests; for example, none (0%) in the experimental group failed test one as compared to four (13.8%) from the control group. Only one student (5.3%) from the experimental group failed test two compared to twenty (69.0%) from the control group. Twelve students (41.4%) from the control group failed test three compared to three (15.8%) from the experimental group. Lastly, nearly half of the students (48.3%) failed test four from the control group compared to one (5.3%) from the experimental group.
Performances in class tests were extended to their Duly Performed (DP) marks. Results show that all 19 (100%) students from the experimental group achieved at least 40% for the DP that gave them admissions to the final examination. However, just above 50% of the control group got at least a 40% final examination admission. The rest of the students failed to qualify for the examination admission.
In terms of performance, the overall pass rates for the GIL and traditional learning approach students were 89% and 52%, respectively, for the university introductory programming course. Watson and Li (2014) report that the global pass rate for programming courses is 67.7% which is significantly lower than the one achieved for the experimental group of this study. Furthermore, the same authors report South Africa's overall failure rate as being approximately 45% for the same course; and the finding for the control group in this study (48%) was close to their findings and hence confirms the results of Watson and Li (2014). The average year mark obtained by the students in the experimental group and control group were 59.53% and 45.10%, respectively. This supported the findings by another researcher from the same institution who experimented with a similar approach in an Engineering programme (Louw, 2012). The author reported that the class average improved to 55% when students were taught using the guided inquiry based learning approach as compared to the 46% when students were taught using traditional methods.
In conclusion, the GIL approach, as opposed to traditional approaches, used for teaching entry-level students enrolled for computer programming had a positive effect of their course achievements, thus the null-hypothesis (H0) is rejected.
Various themes emerged from the qualitative data gathered through the focus group interviews. Focus group interviews were conducted among the students who were part of the experimental group. Of the 19 students, one student did not participate in the focus group interview. Four interview sessions were conducted among the remaining 18 students. They were divided into groups of four (two groups) and fives (two groups) for the focus group interviews. Each focus group interview lasted for about 50 to 55 minutes.
The themes that emerged were:
Theme 1. Group Sessions helped understand the subject content better
Difficulty in understanding the subject content and applying them are viewed as one of the major challenges faced by entry-level programming students by many researchers (Bergin & Reilly, 2005; Derus & Ali, 2012; Schoeman, 2015; Shuhaidan et al., 2009). There was consensus among students that the peer assistance, through group sessions, helped them understand the subject content better. Responses from students as given below in verbatim prove this:
FG1 P1: May be we won't understand the way the educator explains the things whereas if it is from your peer make more sense. I think it is a really good idea. It works for me, my opinion FG1 P4: As my fellow classmates has said - it has helped me a lot because we communicate with group members and understand more complex things than may be the teacher just explains… FG3 P3: Interactions within the class mates..its really helped because sometimes that person understand the question more, like an advocate that member can explain to others like when we are done with the lecture. Then like it will help us understand more. Theme 2. Group session experience assisted students while doing their homework alone.
Entry-level students are required to develop a diverse range of skills such as problem analysis and problem solving at an early stage of their studies (Falkner & Munro, 2009), but studies have proven that some students fail to know where to begin in attempting to get to the solution (Huggard & Goldrick, 2009). Students used their group session experiences and approaches when they were doing their homework. The questions they asked and were being asked during the group sessions worked as a 'guide' on how to analyse the problem. Though there was no fixed rule, through their responses it was evident that they learned to approach a problem scenario systematically questioning themselves to understand and analyse the problem to reach alternate solutions. The following students' responses ascertain this conclusion:
FG1 P1: ..during the group discussions, we will first analyse the problem. What is it that we want to solve and how can we solve it? Then, I list the alternative way on how to solve it and then I choose the most appropriate one. When I am alone – like…firstly, I have to identify the kind of a problem that I want to solve. Look for the solutions then choose the best one…then okay, vary them then choose the best one. It helped me to fully analyse what is it that I want to solve and how can I solve it
FG1 P5: If you have a problem sir….when you are alone…. if you ask the right questions to yourself like we did in the groups and follow the process on how to come up with the solutions mostly by answering those questions asked...then you will solve the problem, sir. Yes…it was totally different from how I used to solve any problem before… FG2 P2: …before I approach any question, I am trying to use the skills during discussions. Ask myself many questions…to analyse the problems lists all steps in how to solve the problem and find most effective ways to solve the problem. FG3 P1: Now you know which questions to ask yourselves to analyse. From the above listed responses it is clear that GIL sessions give students the belief that there is a solution to every problem and they can engage in conversations through asking critical questions which can eventually lead them to a solution.
Theme 3. Students a ppreciated alternative problem solving approaches.
The study of algorithmic problem solving is at the core of learning computer programming and it is well documented that entry-level students struggle to mastering problem solving skills (Lishinski, Yadav, Enbody, & Good, 2016; McCracken et al., 2001; Sheth, Murphy, Ross, & Shasha, 2016). Students stated that they learned to acknowledge and appreciate the fact that there were different ways to solve a problem as different individuals could approach a given problem scenario differently. Groups sessions taught them that a given problem scenario could be solved in different ways as their peers in the group came up with their own ways of solving the problem. The following responses from students provided valuable insight into this:
FG1 P2: (GIL) has a positive impact because programming is not always done in a single way. Like for example, I just see how the class members found the problem in different ways, for example you got a question and you argue in the first way, but he gets it in the other way, but you still get the same answer. So you get to see how there are different ways. FG2 P5: When we put in our possible solution to a problem, group will come up with the best possible answers to that problem. FG3 P2: We've all come up with different solution on how to solve the problem then we look the most appropriate or the most correct way or the one that will be easier for us to understand…., the most appropriate one that will help us to be able to solve even related problems to that one. Students tend to follow the solutions that are given by lecturers and fail to look for different ways of solving a problem in a typical traditional teaching environment. The active learning environment inspired them to come up with their own ways of solving the problem. This in turn improved their problem solving skills. Students constructed their own solutions rather than acting as receivers of ideas from the lecturer
Theme 4. The social networking platform facilitates GIL sessions (out of the classroom)
Features made available through the virtual groups that are found in social networking platforms such as WhatsApp have the potential to make learners active in the learning process, boost informal communication between learners and teachers and create an anxiety-reducing environment (Awada, 2016; Bouhnik & Deshan, 2014). As part of the study, a social networking platform (WhatsApp in this study), was used to facilitate a GIL environment among the students while they were out of the classroom environment. Groups of 4 to 5 students were created over WhatsApp replicating the classroom groups and they were encouraged to engage in discussions through these groups. Students found this effective and used it extensively to their benefit while away from the classroom, though there was no special incentive given to students such as extra marks for participating in online discussions and collaboratively working on the programming tasks. Responses from the interviews as given below suggest that the experiment to create a GIL environment over virtual space has attracted the new, digital- generation students.
FG1 P1: …there is no better way to educate a young mind in this generation now, than using social network. Cause, if you put something educative on social network, it will spread, it will be viral. Everyone will learn about it. And, cause, now life now is about technology and everything. So, if it is out there, spreading, more chances are that young adults, as us, will learn about it – enriching our minds and learning everything. So it helps with that for me.. FG2 P2: There was this WhatsApp group was created. When we do the home work, we type it and post. It helped. My group mates and I discuss…and lecturer did tell us if we were doing completely opposite through WhatsApp and post questions. In a way it was a classroom there in WhatsApp..it helped. FG4 P1: We had some WhatsApp groups. We do communicate with others like when we have those lazy moments of hours at home, hei I am not sure about this question like, then we go to WhatsApp and discuss like don't you know this and that. In that way my group members help me on continuing or making sure that my answer is in the right track.