 |
Asia-Pacific Forum on Science Learning and Teaching, Volume 19, Issue 1, Article 10 (Jun., 2018) |
A quasi-experimental research design with a non equivalent control group and a posttest-only was used in this study. Two intact groups were utilized in the study. One group used the problem-solving learning model based on multiple representations while the other group used the problem-solving learning model. The problem-solving learning model based on multiple representations was as an experiment group, while the problem-solving learning model was a control group. The research design is listed in Table 1.
Table 1. Quasi-experimental research design with an equivalent control group and a posttest-only
Group Pre-treatment Treatment Post-treatment Experiment -
X
P1
Control -
Y
P1
P1 = Student's cognitive learning achievement
X = Problem-solving learning model based on multiple representations,
Y = Problem-solving learning modelThe study was carried out with 50 students and was conducted in one of the senior high schools in Yogyakarta (Indonesia) on 11th-grade which divided in two groups: an experiment group (26 students: 11 male and 15 female) and a control group (24 students: 15 male and 9 female). This research was conducted from October to November 2017.
The students’ cognitive achievement test (SCAT) was prepared and developed by the authors. It was implemented as posttest 29 items were implemented in the research and the items were four choices. The purpose of SCAT is to determine the types of student representation of conceptual understanding related to the topic of chemical equilibrium and to express alternative representations of the subject. The SCAT was carried out after the treatment of experimental model and control model. Other instruments were made by researchers to support teaching and learning process of learning instrument that is Learning Implementation Plan based on the syllabus in school and student worksheet. Two experts in chemistry education reviewed each item and the content validity of the SCAT. The items were revised based on suggestions submitted by the experts. Chemical content, an indicator of competency, type of representation and cognitive level of the instrument are shown in Table 2.
Table 2. Grid question to measure student's cognitive learning achievement
Chemistry content Indicator of competency Question No. Type of representation Cognitive Level
(Bloom)Reversible and irreversible reaction Write down the equation for reversible and irreversible reaction 1
Symbolic C1
2
Symbolic and microscopic C4
Differentiating reversible and irreversible reaction 3
Microscopic C1
4
Macroscopic C4
Dynamic equilibrium Describes dynamic equilibrium 5
Macroscopic C2
Write down the reactions that occur in dynamic equilibrium and explain the mechanisms that occur at the submicroscopic level 6
Symbolic and microscopic C3
7
Symbolic C2
Homogeneous and heterogeneous equilibrium Distinguish homogeneous and heterogeneous equilibrium 8
Symbolic C2
9
Symbolic and mathematics C3
Factors that affect the shift in equilibrium Predict the direction of equilibrium shift by using Le Chatelier principle 10
Symbolic and macroscopic C2
11
Symbolic and macroscopic C2
12
Microscopic and mathematics C3
13
Symbolic C2
14
Microscopic, symbolic and mathematics C4
Analyze the effect of change of concentration, pressure, volume and temperature on equilibrium shift through experiment 15
Macroscopic and symbolic C4
16
Macroscopic and symbolic C2
17
Macroscopic C3
18
Macroscopic, symbolic and mathematics C4
Equilibrium constant Determine the equilibrium constant of a reaction 19
Symbolic and mathematics C2
20
Microscopic and symbolic C3
21
Symbolic and mathematics C3
22
Microscopic, symbolic and mathematics C3
Calculates the Kc price based on the concentration of the substance in equilibrium and the Kp price based on the partial pressure of reactant gas and the reaction product in equilibrium 23
Symbolic and mathematics C3
24
Microscopic and Symbolic C4
25
Microscopic and mathematics C3
26
Symbolic and mathematics C3
Determine the relationship between Kc, Kp, and degree of dissociation 27
Symbolic and mathematics C3
28
Symbolic and mathematics C2
Interpreting experimental data on reagent concentrations and reaction products in equilibrium to determine dissociation and equilibrium levels 29
Symbolic and mathematics C3
Table 2 above is an instrument grid that has not been tested for its validity and reliability. Based on the validation result, the question of no 2 da 12 is not valid and reliable so it is not used for the next step.
Validity and Reliability Instrument
Validity
The instrument consisting of 29 multiple choice questions has been validated in the form of content validation and item analysis. The content validation was done by two experts. The items are analyzed by using the RASCH model with WINSTEPS 3.73 program to determine that the item matches the model or not. According to Boone et al. (2014), the criteria used to check the suitability of outliers or misfits in the RASCH model are
- The value of outfit mean square (MNSQ) received: 0.5 < MNSQ < 1.5
- The accepted Z-standard (ZSTD) outfit value: -2.0 < ZSTD < +2,0
- Point Measure Correlation Value (Pt mean Corr.): 0.4 < Pt Measure Corr. < 0.85
Outfit mean square, outfit Z-standard, and Point Measure Correlation (Pt Measure Corr.) values are the criteria used to see the suitability level of items (item fit). If the item does not meet all three criteria, then the item is not good so it needs to be repaired or replaced. But if the item meets at least one of the criteria, then the item can be maintained. Based on Rasch analysis, there two items are deleted because it is not fit to Rasch model.
Reliabilit
Based on the results of analysis using RASCH model of 27 tested questions, obtained the reliability value as follows
a)The Cronbach alpha value obtained is 0.87. This indicates that the interaction between the person and the items as a whole is very good.
b)The value of Person Reliability generated is 0.86 while the Item Reliability value is 0.91. This shows that consistency of students in answering questions is included in the good criteria and the quality of items in the instrument has a very good reliability aspect.
Wright map analysis (person-Item Map)
This analysis is done to know the distribution of students' ability and distribution of problem difficulty level with the same scale. This analysis will show the most difficult and easiest items to solve by students. The analysis was conducted separately from the experiment group and the control group to be able to determine the effect of applying the problem-solving model based on multiple representations and the problem-solving model.
The questionnaire items consisting of 27 questions tested on the students were analyzed using the Rasch model to determine the distribution of students 'abilities and the distribution of students' difficulty levels. The result of item analysis by Rasch model in the experimental group shows that the item No. 24 and 23 are most difficult, while the No. 3, 10, 16, and 26 are easiest. In the control group, the No. 7, 8 and 22 are most difficult, while the No. 1 and 10 are easiest. The item measure is determined by logit number. Table 3 present the logit number of the item. The result of analysis of all items are depicted in Figure 1 for both the experiment group and control group.Table 3. The logit number of the item.
Group Item number Measure (logit number) Difficulty level Experimental Group 24
3.03
Most difficult 23
2.55
3
-3.30
Easiest 10
-3.30
16
-3.30
26
-3.30
Control group 7
3.19
Most difficult 8
3.19
22
3.19
1
-4.59
Easiest 10
-4.59
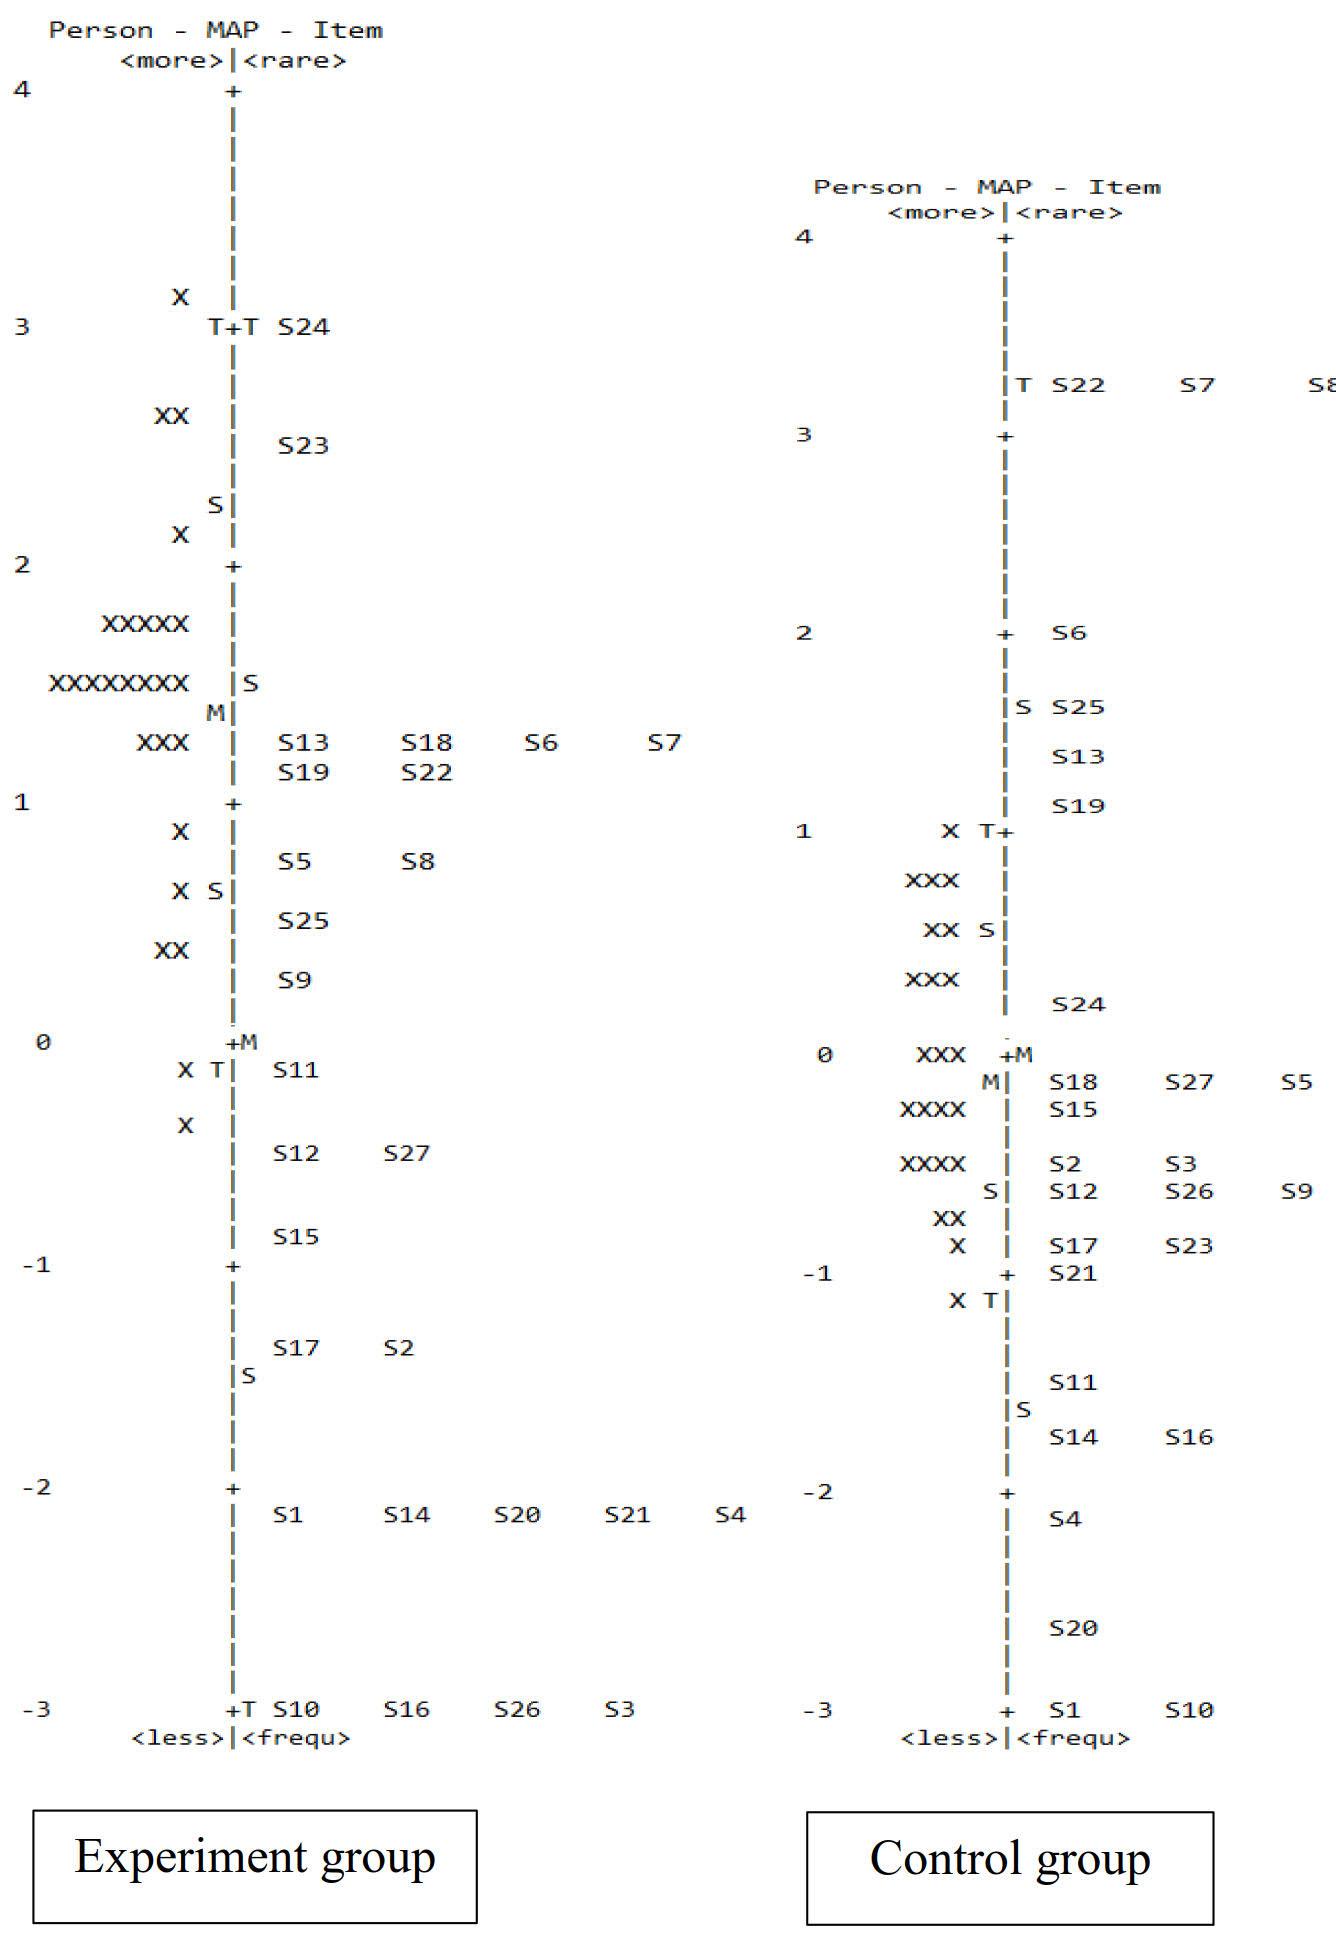
Figure 1. Item map in the experiment group and the control groupData analysis technique
Prior to the inferential statistical analysis, it is necessary to perform prerequisite analysis first with the data normality test and homogeneity test of each sample.
a) Normality Test
Normality test using Kolmogorov Smirnov (K-S) test (Chakravarti, Laha, & Roy, 1967). The test criteria are data derived from normally distributed populations if the probability of significance value (p > 0.05), and the population is not normally distributed if the value of significance (p < 0.05).
b) Homogeneity test
Homogeneity test used in this research is Levene test (Levene, 1960). Homogeneity test aims to find out the homogeneity of variance for each class. Homogeneity test in this research using test result data on previous material that is reaction rate. Testing criterion is experiment class variance and control group is homogeneous if value significance > 0,05 whereas if significance value <0,05 then stated data distribution is not homogeneous.
c)The Independent t- test
If normality and homogeneity are met, then it is followed by an independent test of t-test (Snedecor & Cochran, 1989). This test is used to find out whether there is an average difference between two unpaired samples. The basic decision-making in this test is:
- If Sig. (2-tailed) < 0.05, then there is a significant difference in student cognitive achievement between the experimental group and the control group
- If Sig. (2-tailed) > 0.05, there was no significant difference in student cognitive achievement between the experimental group and the control group
