|
Asia-Pacific Forum on Science Learning and Teaching, Volume 19, Issue 1, Article 13 (Jun., 2018) |
The findings obtained from the drawings of the students about the outlook of a scientist are given in Table1.
Table I. The outlook of a scientist
In Table I, the data obtained from the students before and after the application about the outlook of scientist are interpreted. It was observed that most of the students had stereotyped images about scientists before the application. However, when the drawings on the images were evaluated, it was observed that there was no laboratory coat and mustache both before and after the application. On the other hand, it is interesting that all of the stereotypical images about the outlook of scientists changed after the application.
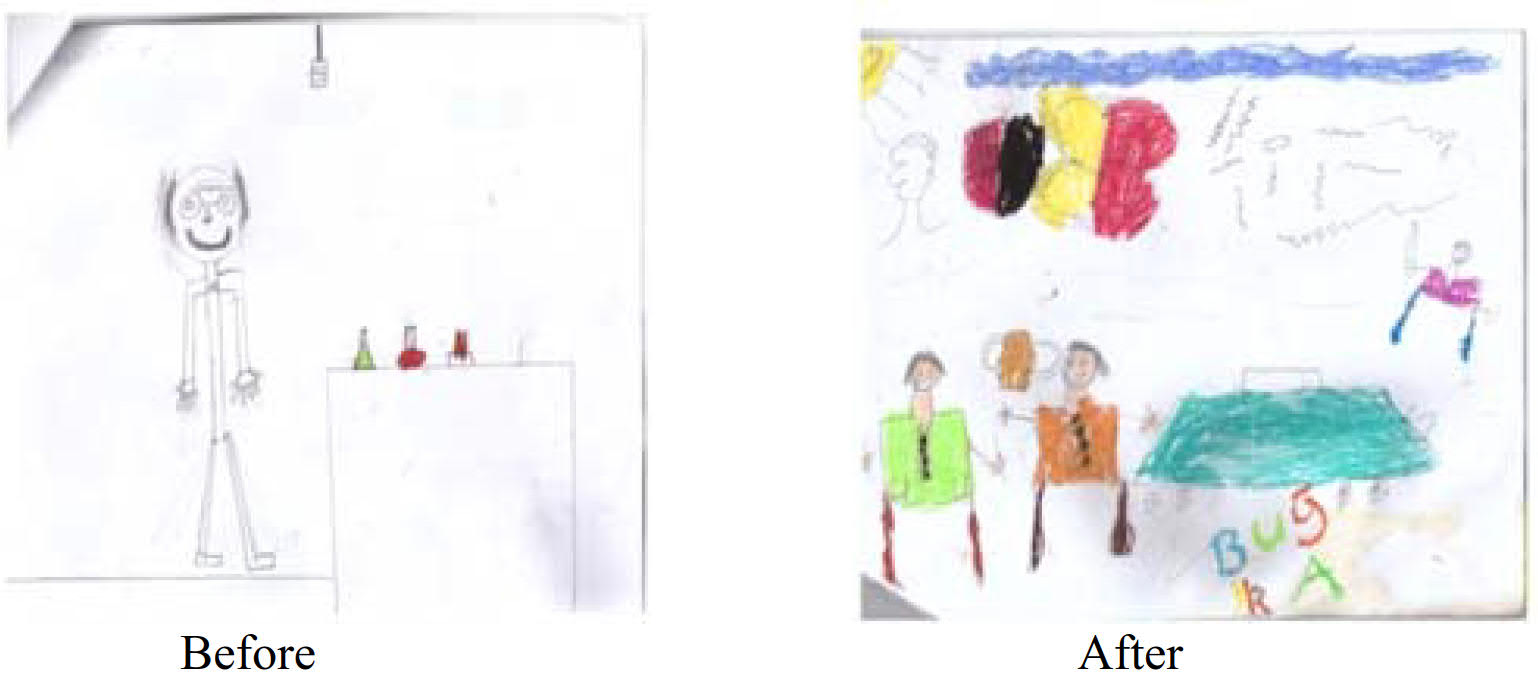
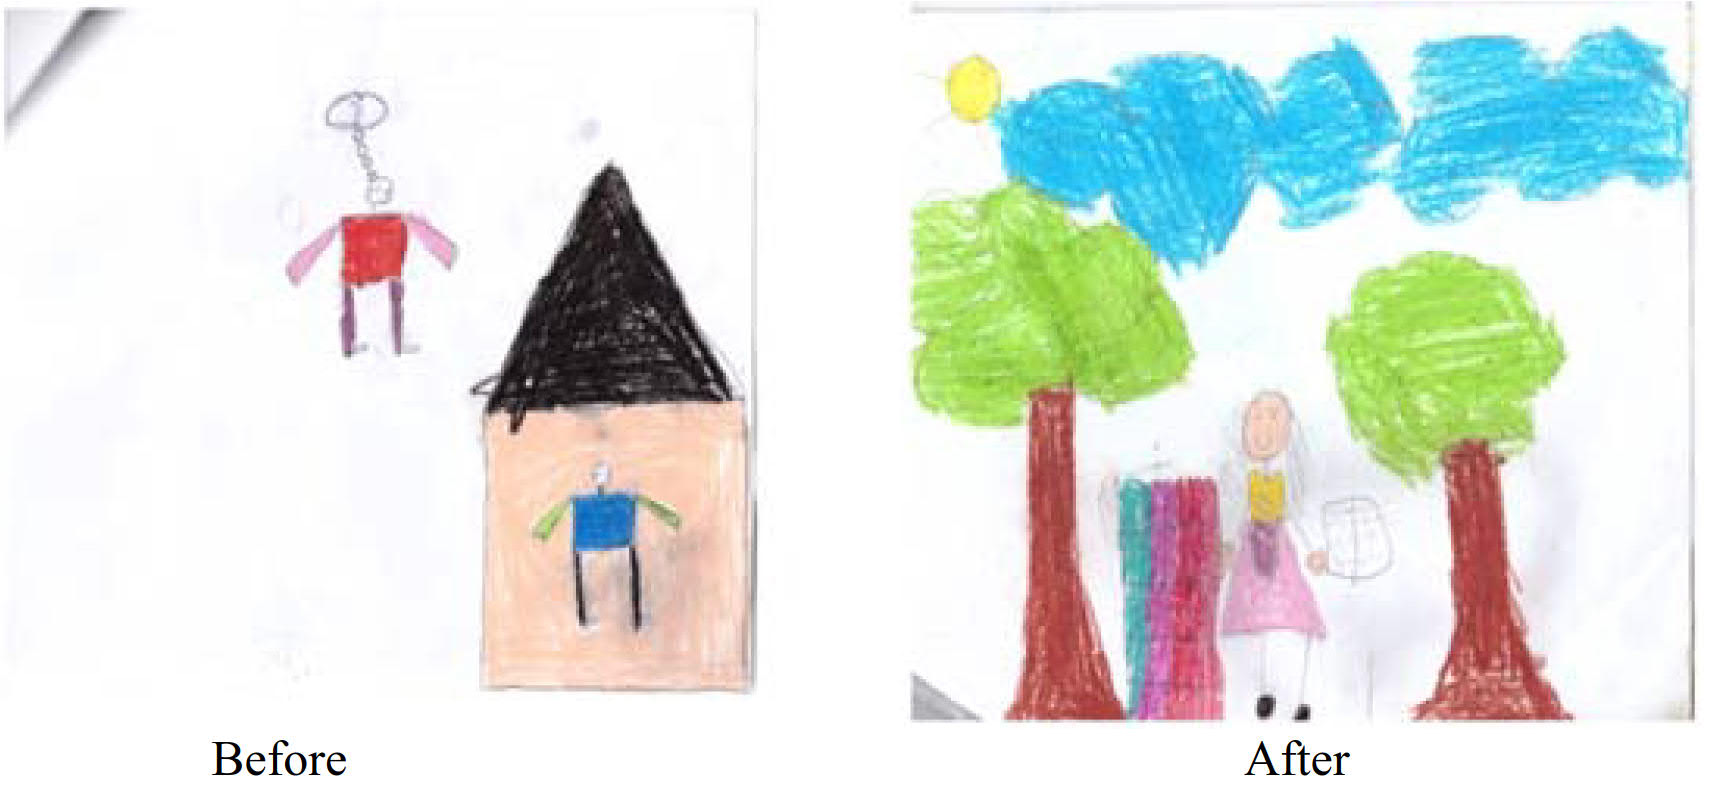
Figure 1. Drawings on the outer look of a scientist
When Table 1 and Figure 1 are examined together, after the application, it is observed that the scientist does not wear glasses and the hair is smoother.
The findings obtained on the research symbols used by scientist in the drawings of the students are given in Table II.
Table II. The research symbols used by scientist
Before Application After Application According to Table II, it was observed that test tubes were used as the research symbol by all students before the application (67% in girls, and 50% in boys).In addition, it was also observed that one girl and one boy drew an experimental animal, and one boy student drew a plant. After the application, on the other hand, it was observed that none of the girl and boy students drew any research symbols.
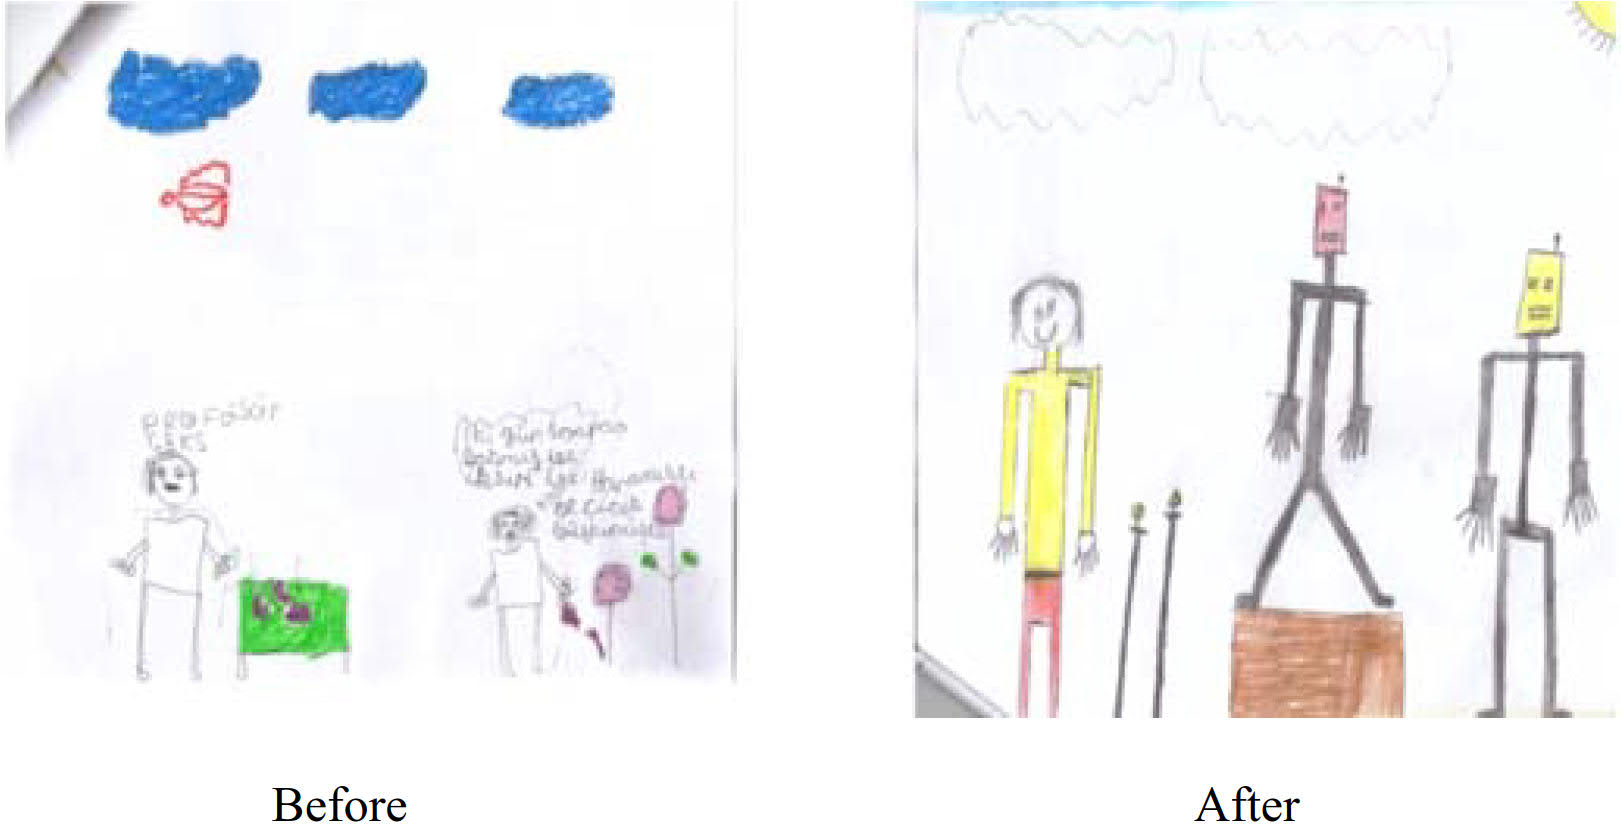
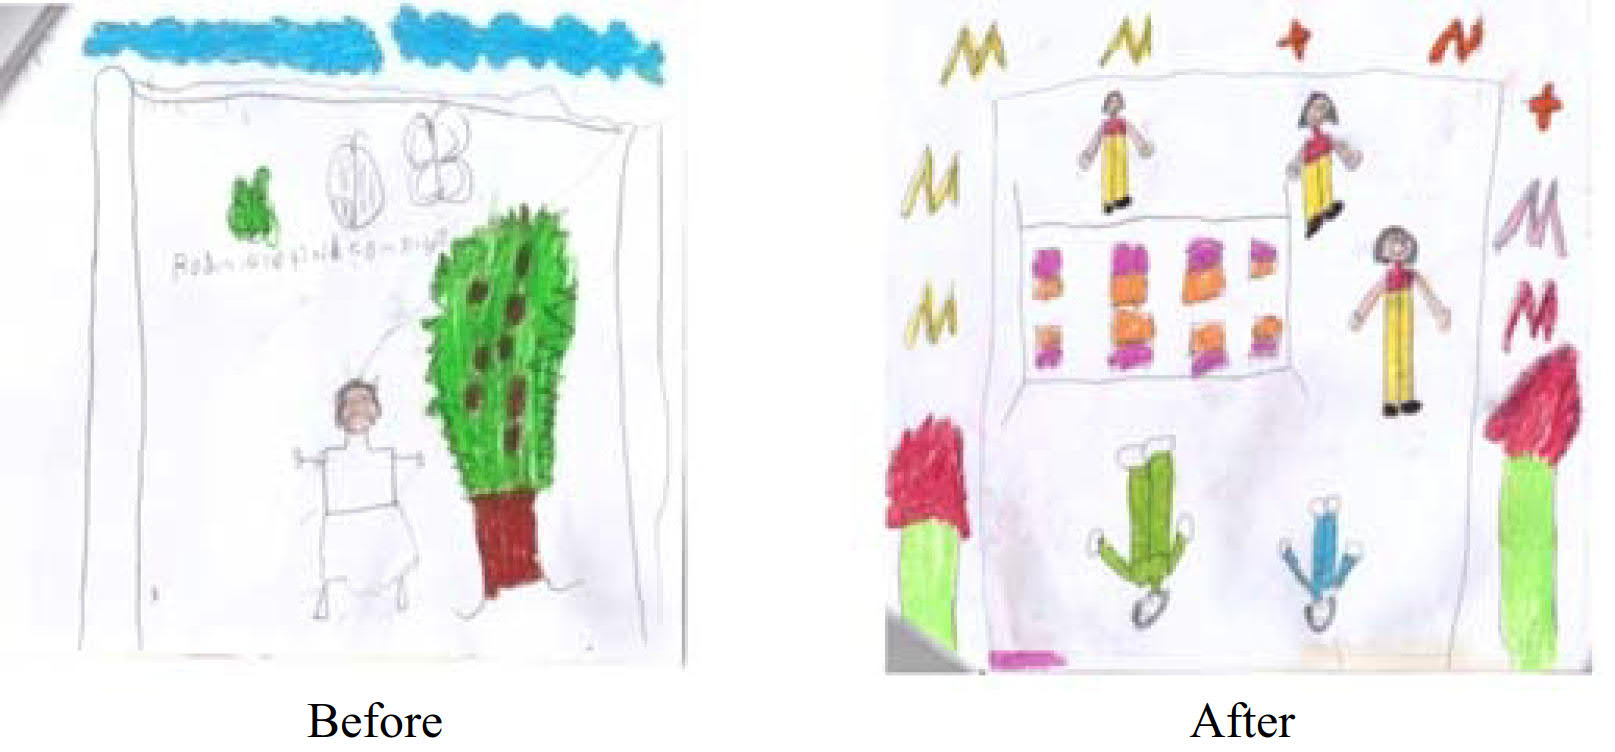
When Figure 2 is analyzed it is observed that one male student drew a scientist, which he claimed having seen in the media. In this drawing, the scientist is preparing elixir and ensures that a plant grows and developed with the help of this elixir. The drawing after the application belonged to a boy student again, and depicted the scientist as receiving praises after research, and should be rewarded.
Figure 2. The drawings on the research symbols used by the scientist
The findings on the knowledge symbols which were obtained with the drawings of scientist by the students are given in Table III.
Table III. The informative symbols used by scientist
Before Application After Application When Table III is analyzed it was observed that the students used knowledge symbols -although few in number- before the application. This was a book symbol drawn by a boy student, graphics/mathematical expressions drawn by two girl students, and graphics/ mathematical expressions drawn by two boy students. After the application, it was determined that one boy student used the book symbol; however, it was a different student. The graphics/ mathematical expressions were decreased in girl students after the application, and completely disappeared in boy students.
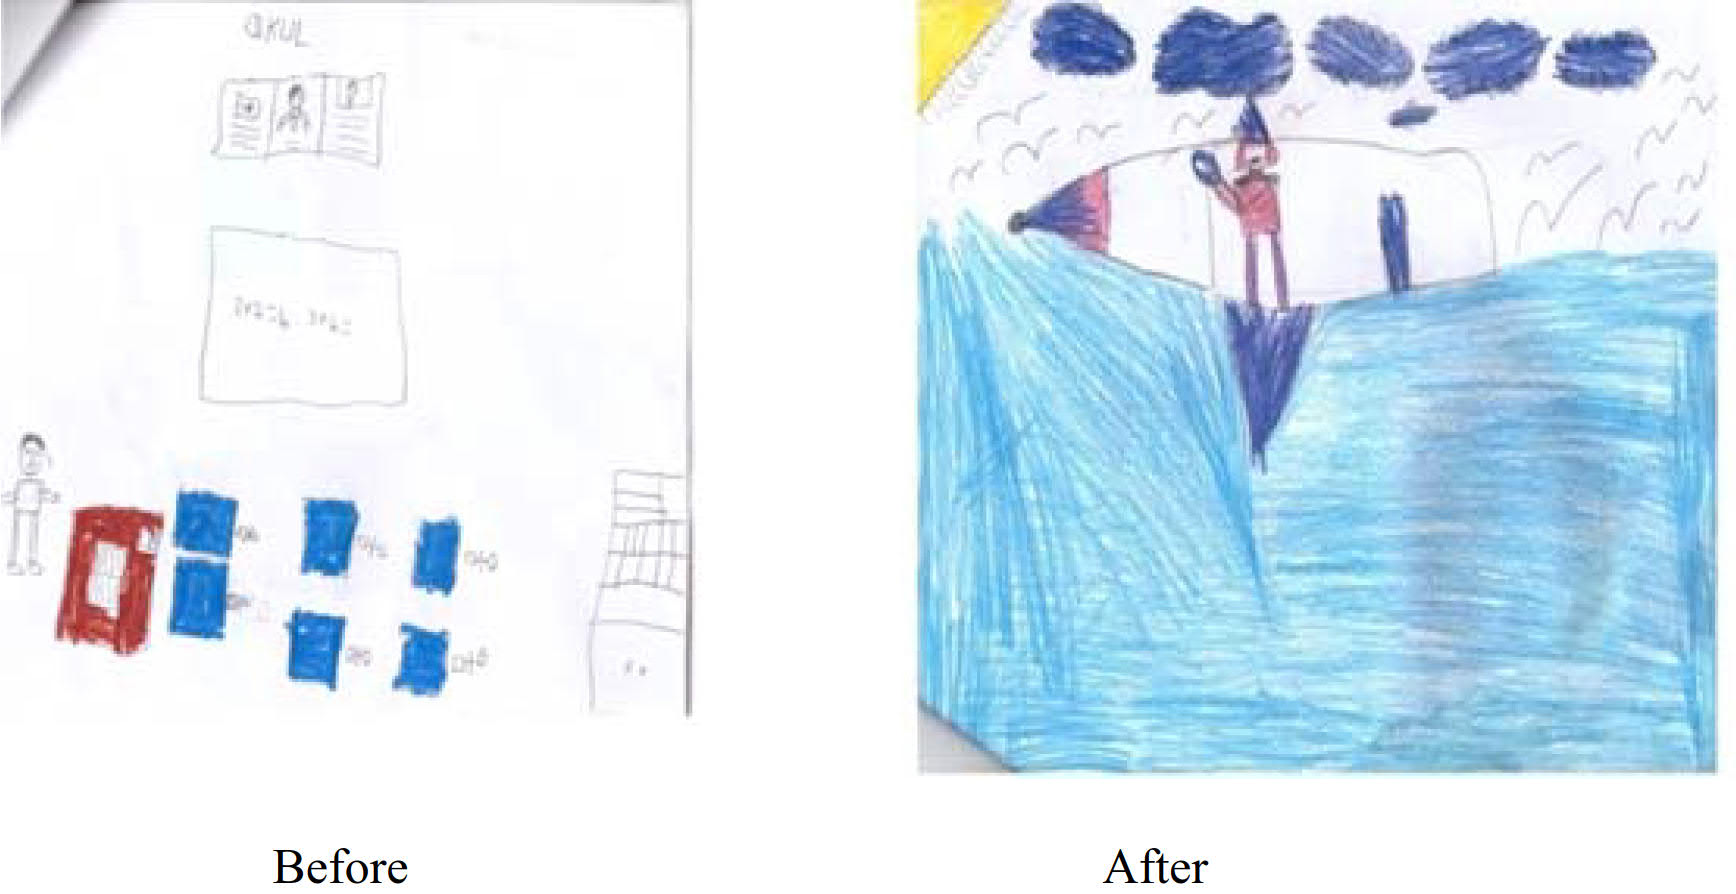
Figure 3. The drawings on the informative symbols used by the scientist
It was observed that there were clear differences between the drawings of the students about scientists before and after the application.
The findings on the technological products used by scientists drawn by students are given in Table IV. However, interesting findings were obtained here. In this context, none of the students drew technological products before the application, and one girl and one boy student drew planes, and one boy student drew a computer after the application.
Table IV. Technological products of the scientist
Before Investigation After Investigation
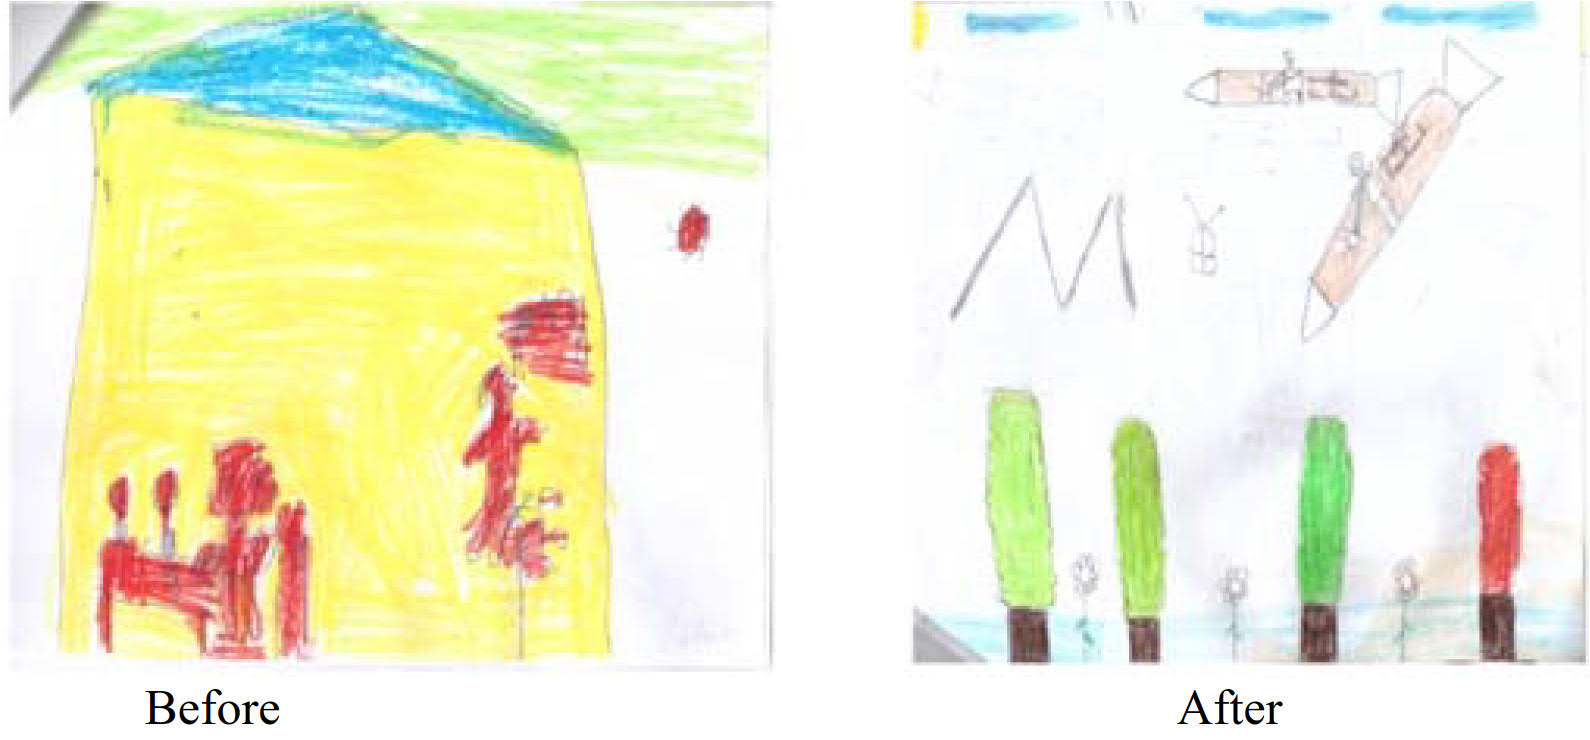
Figure 4. The drawing on the technological products used by the scientist
A drawing that was not in favor of the students was determined before and after the application. In this context, two students drew planes after the application. Possible reasons for this may be discussed in the discussion section.
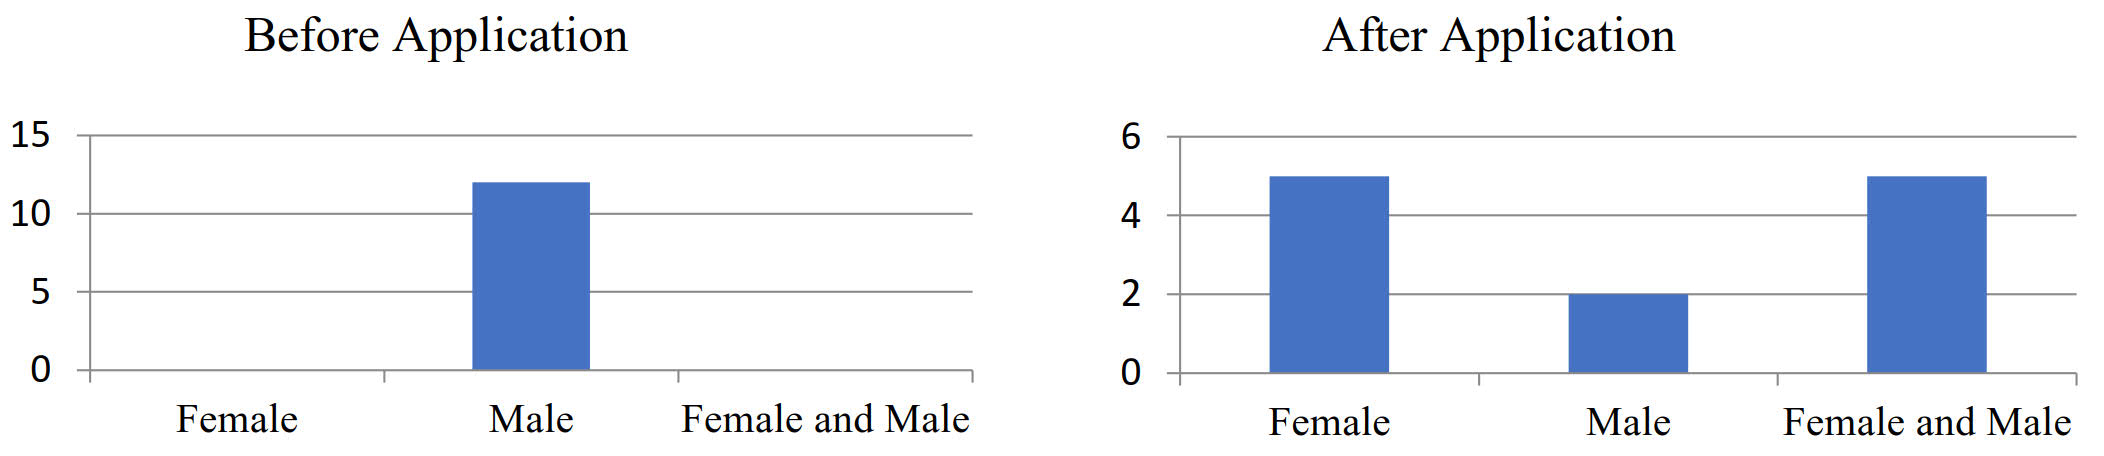
The findings obtained about the gender of the scientist image by the students are given in Figure 5.
Figure 5. The criterion of gender
When the scientist drawings of the students before the application were analyzed it was observed that all students had a male scientist perception. After the application, it was observed that this rate was decreased, and the students drew male and female scientist working together. The examples of the drawings in which the mental images on the gender of scientists are given in Figure 6.
Figure 6. The drawings on the gender of the scientist
Based on the drawings of the students, the findings on the facial expressions of the scientists by the students are given in Table V. When this table was analyzed it was observed that the facial expressions of scientists did not change much before and after the application. When Figure 7, which include the examples of the drawings of students, and Table 5 were analyzed together it was observed that the students generally depicted scientists as happy people.
Table V. The facial expression of the scientist
Before Application After Application
Figure 7. The drawings about the facial expression of the scientist
Based on the drawings of the students, the findings about the characteristics of the environment where the scientist works are given in Table VI.
Table VI. The working environment of the scientist
Before Application After Application When Table VI was examined, before the application, students imagined scientists in laboratory (67% in girls, and 50% in boys) and in the nature/garden (50% in boys and girls). According to the images of the students after the application, there were decreases in the rates of the drawings that depicted scientists in laboratory (one girl) and in the nature/garden (two participants in girls and boys). After the application, students reflected the working environment of scientists in different ways. These rates are close to each other, and it was observed that one participant preferred to draw the scientist in a laboratory, two participants depicted the scientist at home, and a total of six participants did not show the scientist in any environment.
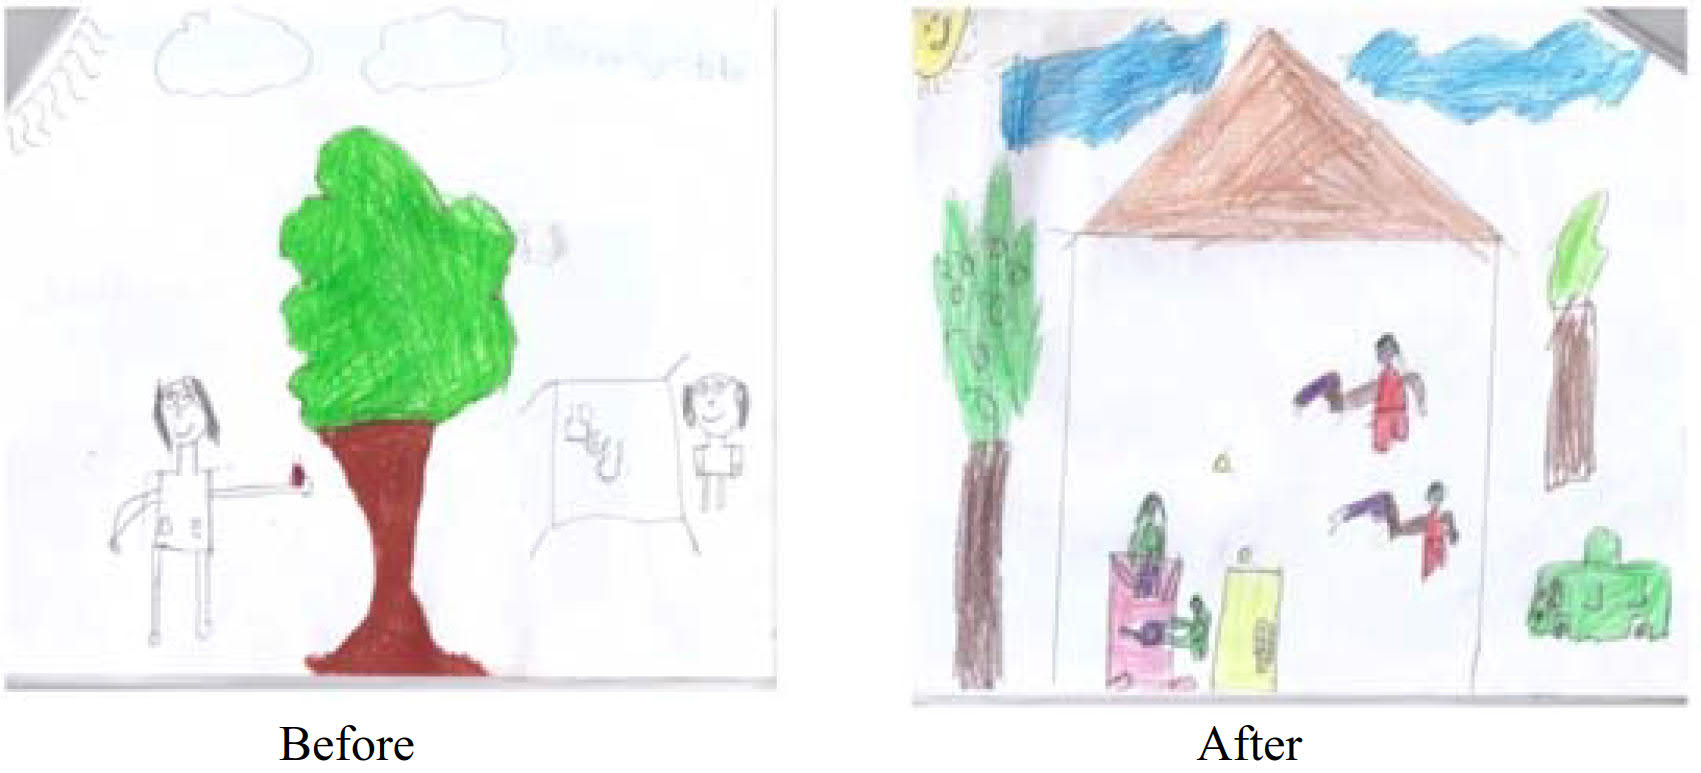
The examples of the drawings of the students on the mental images of the working environment of scientists are given in Figure 8.
Figure 8. The drawings on the working environment of the scientist
When the viewpoints of the students written in the diaries were analyzed, the perceptions on scientist are summarized in Table VII.
Table VII. The perception about the scientist
When Table VII was analyzed it was observed that after the application, most of the students (75%) considered the scientist as clever/wise. Again, most of the students (50%) imagined scientists as hardworking people. The students stated that they wanted to meet Aziz Sancar if they were given the opportunity of meeting him, and ask him why he preferred science. Right at this point, girl students mostly stated that they wanted to meet Amelia Earhart, and boy students stated that they wanted to meet Aziz Sancar.
Finally, a statistical analysis was carried out in order to obtain a general picture. The items in the checklist used to evaluate students' drawings were scored. According to this, each symbol in student drawings was scored as 0-1, and it was tested whether there is a statistical difference in student drawings . The Wilcoxon Signed-rank test results are presented in Table VIII.
Table VIII. Wilcoxon Signed-Rank test results of pre-and post-test scientist drawing test scores
The results of the analysis shown in Table VIII show that there is a meaningful difference between the pre-test and post-test scores of students participating in the drawing test (z=-2.282, p˂.05). When the mean rank and sum of ranks scores are taken into consideration, it is seen that this difference is favored by the positive rank, that is, the post-test score. It can be said that the implementation which is carried out according to these results is an important influence of the students on the image of the scientist.