 |
Asia-Pacific Forum on Science Learning and Teaching, Volume 18, Issue 2, Article 12 (Dec., 2017) |
|
Asia-Pacific Forum on Science Learning and Teaching, Volume 18, Issue 2, Article 12 (Dec., 2017) |
The method used in this research is the method of mixed methods (Creswell, 2014), which emphasizes on data collection by involving the processing of quantitative and qualitative data that is done simultaneously during the development process. In this regard, same test was implemented as pre-, post-, and retention with in one group experimental design, as exposed in Figure 1.
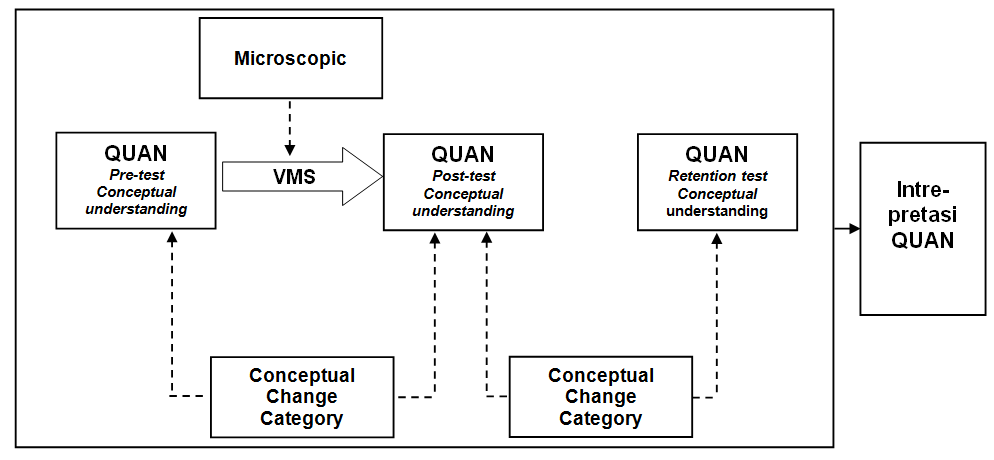
Figure 1. Sequential Explanatory Research Design
Based on figure 1 The information method used in this research is the method of mixed methods, the quantitative study stage in this study, quantitative and qualitative data were collected simultaneously to answer different research questions (different data types). The steps in this research are: 1) collect quantitative and qualitative data and analyze it (planning stage); 2) use the analysis to develop VMS (development stage, qualitative data); and 3) applying VMS has been developed on population samples (Stages of media applications to obtain quantitative data and analyze them).
The Research was conducted on 80 students, whose age ranging from 19 to 21. Before the treatment, the pre-test was applied to determine students’ prior understanding about heat transfer (conduction, convection, and radiation). The treatment was utilized using Virtual Microscopic Simulation (VMS) in the experimental group. After the treatment; the same test was administered as post-test to all students. Finally, the same test was administered as retention test for retention of students’ understandings.
Table 2. Sample Test Implementation
Gruop
Learning strategis
Sample / Years
Variabel
Experimental
Conceptual Change with Interactive Lecture Demonstration (ILD)
80 Students / 2016
Conceptual Understanding
Based on Table 2. Sample of sample implementation test with 80 students for conceptual change oriented physics learning. Sample of implementation test taken by purposive sampling that is sample determination technique with certain consideration. The consideration of research sample selection is because based on information from preliminary study result is found that the students of understanding the concept of physics have not fully comprehended physics concept so that this research can build scientific conception.
Virtual Microscopic Simulation (VMS) to Promote Students’ Conceptual Change: Case Study in Heat Transfer for conceptual change oriented physics learning using a written test instrument in the form of a description to measure students' level of understanding. Table 3. Instrument Test Implementation
Data Type
Data Type
Data Type
Data Type
Type Conceptual Understanding
The written test
Students
Essay of the concept
Based on Table 3. Instrument test implementation of research the change of students' type conceptual understanding as elicited in students' written responses. The number of conceptual change was described by Progress, Maintain-Correct, Maintain-Partial Correct, Maintain-Incorrect, Retrogression from pretest to posttest and from posttest to retention test.
The treatment (i.e. VMS) consists of three parts concept, namely conduction, convection and radiation. Simulation is used to build understanding of heat transfer concept. This media is created using Macromedia Flash 8 main software and design drawings using the Corel Draw.
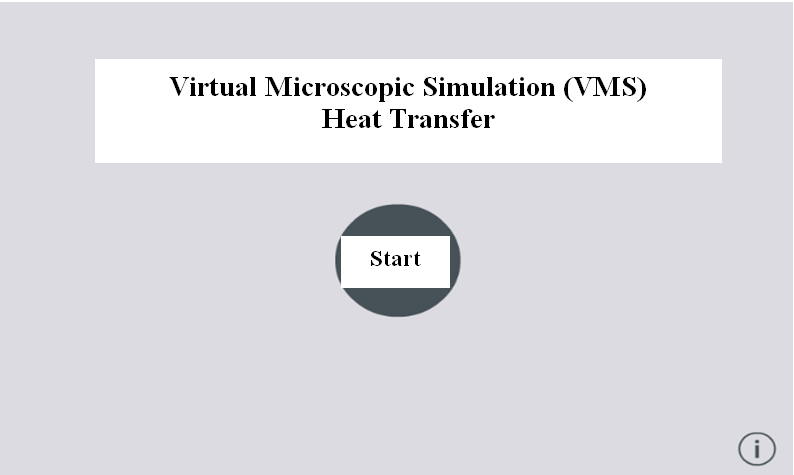
Figure 2. Main Menu Display of VMS (Used with macromedia flash 8)
The result of development in the form of computer program, which can present visual effect of process of microscopic heat transfer on computer screen. The process of heat transfer that is presented include conduction, convection, and radiation.
The design of the developed media display contains two views, namely the initial display and simulation display. The initial view of the media is the main view when the simulation application is opened. When the user opens the simulation application, then the initial view that appears is like the following picture.
Figure 3 is a picture of conduction of the metal when heated. When the metal is heated to other end of the metal will feel the heat, but we know what kind of heat propagation. This simulation seeks to explain how explanation there is. Besides, the most important part of the simulation is to explain microscopic constituent particles of metal when heated. VMS conduction section there is two parts is material conductivity A and conductivity material B.
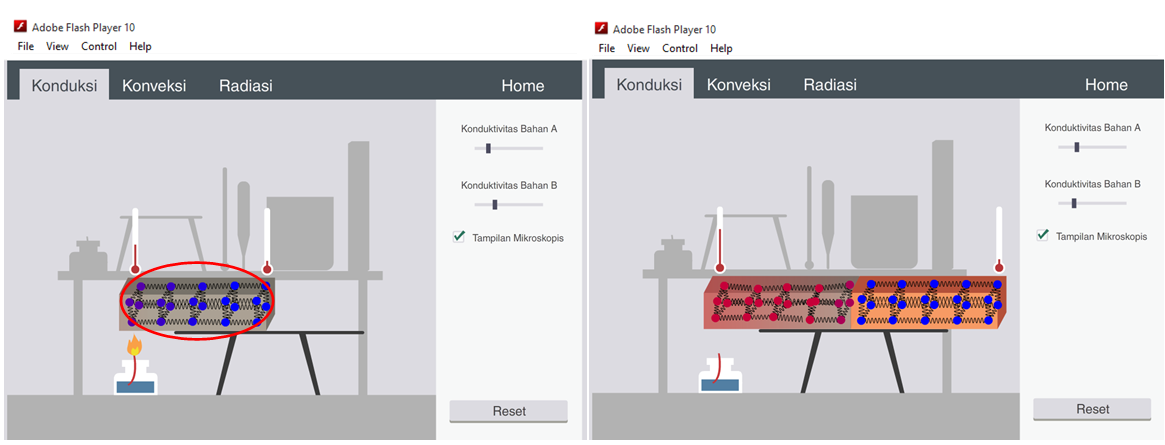
Figure 3. VMS Conduction: Microscopic of the Material is Heated
In the conduction simulation display, there is one rod placed on the support table, where at each end of the rod is placed a thermometer to see the changes macroscopically when the heat transfer occurs. At the bottom of one end of the rod is placed Bunsen as a heat source.
The simulated form that can be performed on this screen is a conduction heat conduction simulation on one end of the heated rod using Bunsen. This simulation serves to show the process of conductive heat transfer and counter the students' misconception on the concept of conduction, where the student assumes that, ”In conduction event, heat flows because it is carried by the molecule of the transporting agent”. In this simulation, microscopic process of heat transfer in conduction. The heat transfer can be observed by the occurrence of temperature rise at the tip of the stem that is not in direct contact with the heat source using a thermometer. In addition microscopically (through the representation of bonds between elements in solids with springs) the heat transfer can be observed with particles composing the ends of solids that are in direct contact with the vibrating heat source is stronger than the particles that do not experience direct contact with the heat source. The greater the vibration, the kinetic energy is also greater. The large kinetic energy causes the nearby particles to vibrate to become stronger than before, and so on down to the other end composing particles. This can be seen also by changes in the particle color gradation from blue (indicating still low temperature) to reddish color (indicating high temperature).
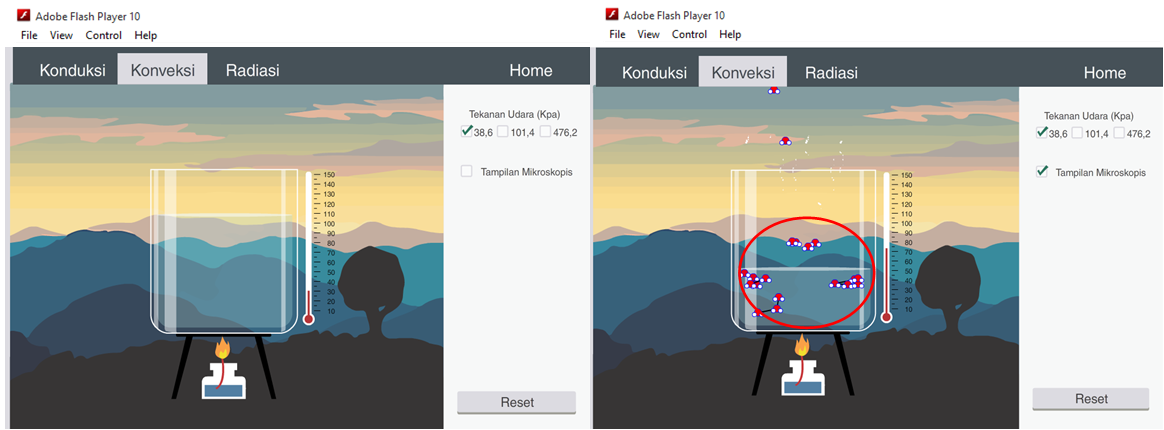
Figure 4. VMS Convection: Microscopic of Heat the Water in the Mountains (38,6 Kpa)
The simulation form that can be done on this screen is the convection of convection while cooking water. In addition, the simulation of this convection can also be shown variations of the boiling point of water due to the influence of external air pressure. This screen simulation serves to demonstrate conventional heat transfer processes during the cooking process of water and counter the students' misconception on the concept of convection, where students assume that, “On convection heat transfer events, the rate of convection gets faster when water is boiling”.
Figure 4 and 5 are pictures of VMS media convection; these simulations explain how the movement of water particles is heated. Water heating is carried out in three different places, namely in the mountains with a pressure of 38.6 kPa, around the beach with a pressure of 101.4 kPa and at a pressure of 476.2 kPa. The movement of water particles in the simulation of this in detail and show the most important part of this simulation is to explain the movement of microscopic water particles when heated.
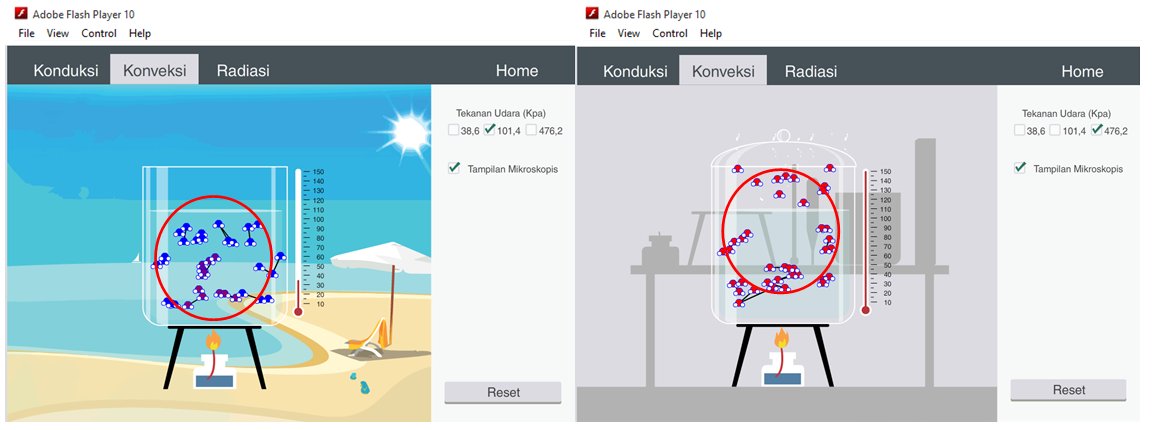
Figure 5. VMS Convection: Microscopic of Heat the Water at the Beach and (101,4 Kpa) and (476,2 Kpa)
In this simulation, we can show microscopic process of convection heat transfer. The heat transfer can be observed by the occurrence of temperature rise in water after heating. In addition, microscopically water particles that are in direct contact with the heat source have greater kinetic energy (can be seen with changes in particle color gradation) than before and move faster. In this section the water molecules move away from each other as a result of this part expansion so that the density of the species becomes smaller than the mass of the type of water that is still cold on it, consequently this water molecule moves up. While the exposed water part moves upward, the water molecules on the left and right sides try to fill the position of the rising water section. The position of a moving water molecule that fills the water position (direct contact with the heating source) rises is replaced by a water molecule above it that moves downward to fill an empty position, and so on
Figure 6 is a radiation image VMS media, these simulations explain how radiation with electromagnetic waves do. This simulation shows wave source toward premises exposed to intense radiation difference of temperature, 2500 K, 3000 K and 4000 K. The constituent particles move in this simulation the show with detail as well as the most important part of this is to explain the microscopic simulations.
When the user clicks the radiation button on the menu bar, the user will be directed to enter the radiation simulation screen. At the beginning of the screen simulation of radiation there are two identical but different colored bars, namely black and white. At the center of the screen is placed a radiation source that can emit thermal radiation on both objects. At each end of the rod is placed a thermometer that serves to see the macroscopic changes as a result of radiation heat transfer process.
The simulation form that can be performed on this simulation screen is the simulation of radiation through thermal radiation transmitters on two different colors in a vacuum. This simulation serves to show the difference of absorption and transmit power between two different color objects. This simulation contributes to counter the students' conceptual understanding on the concept of radiation, where students assume that, "Objects that more quickly absorb radiation heat, slower to emit radiation heat"
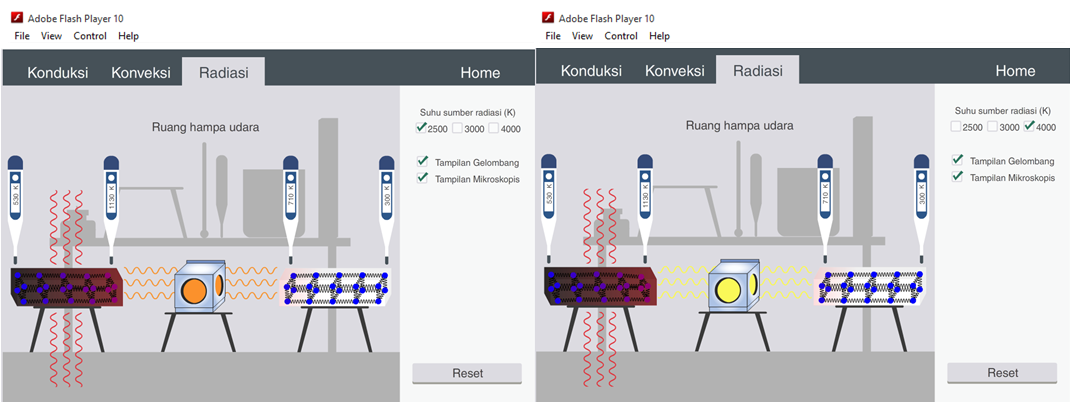
Figure 6. VMS radiation: microscopic of the material is heated to a temperature of 2500 K and 4000 K
In this simulation, microscopic process of radiation heat transfer can be shown. The heat transfer can be observed by the occurrence of temperature changes in black and white objects after absorbing or emitting radiation. In addition, microscopically the particles making up black and white objects that are in direct contact with the heat sources have a greater kinetic energy (can be seen with changes in particle color gradation) than before and move faster, but the kinetic energy of black body particles is greater than that of objects white. Meanwhile, when black and white objects emit radiation, the kinetic energy of black matter particles decreases faster (microscopic) than white matter. This shows that the absorption and power of black body transmit greater than white matter.
Learning strategy use VMS for learning the physics-oriented conception of the material conversion of heat transfer with the following characteristics: (1) display the physical processes of heat transfer in microscopic and macroscopic and as closely as possible with the actual process; (2) accommodate the student conceptual understanding in the material of heat transfer; (3) includes a simulation of the phenomenon of conduction, convection, and radiation; (4) using a constructivism understands that covers the process of assimilation and accommodation; and (5) give the expansion of the learning experience (extension), in order to strengthen the construction of conceptions on students.
Products that have been made are then consulted to be validated by physics and media experts. Validation is done on three aspects: the compatibility of virtual simulation media with material curriculum of heat transfer, virtual simulation media display and interactivity of virtual simulation media. The result of validation of virtual simulation media of heat transfer is shown in Table 2.
Table 2. Results Validation of Virtual Media Simulation of Heat Transfer
No
Validation Score I II III Conformity of Virtual Simulation Media with Curriculum: 1
4 3 4 2
4 3 4 3
4 3 4 4
3 3 4 5
4 3 4 6
4 3 4 Total
23 18 24 Average (%)
21,7 (90,3%) Category
Good Virtual Simulation Media View :
1
3 3 3 2
4 3 4 3
4 3 3 4
3 3 4 5 3 3 3 6
4 3 4 7
3 4 3 Total
24 22 24 Average (%)
23,3 ( 83,3%) Category
Good Interactivity of Virtual Simulation Media :
1
4 3 4 2
4 3 4 3
3 3 4 4
4 2 4 Total
15 11 16 Average (%)
14 (87,5%) Category
Good Repair Suggestions and Conclusions
Validator 1: The background color and animated image are adjusted. Can be used after repair.
Validator 2: The logic aspect of the picture is noticed again. Can be used after repair
Validator 3: The juxtaposition of images in conduction simulation and background selection of the laboratory for conduction and radiation simulation. Can be used after repair.
Media validation is done by three experts in the field of physics concepts, physics and physics learning experts. Table 2 shows that the virtual simulations that have been developed are in accordance with the curriculum of matter heat transfer, as well as with the appearance and interactivity of the media are also quite good. The media can already be used in research after repair. Expert advice is used to improve the media that has been created, so the media really worthy of use in research. Improved media views on expert suggestions and judgments will be presented in the discussion.
The classification of categories set five by She and Liao (2010) in Table 2 were used to analyses the data obtained from the heat transfer concept. The scoring of the text was achieved by the evaluation of the data in the first tiers, second tiers and three tiers.
The students' written responses to open-ended question items were analyzed quantitatively. The analyses showed students’ understanding (pre-, post-, and retention-test) and changing their understandings from pre-, post- and retention test. As analysis procedure, we used three-stages in early outlined, firstly, the researchers began with repeatedly read the students' written responses (pre-, post-, and retention-test). After that step was the advance of a common conceptual understanding rubric that useful to all items and then item specific rubrics consistent with key concepts of heat transfer. The qualitative data collected from students' responses to the items were quantitative into a numerical score based on the item-specific rubrics. This numerical score represented the students' level of conceptual understanding about heat transfer. In order to use statistical analysis for students' conceptual understanding scores, the normal distributions of data were not met for their scores. As a result, nonparametric statistics of Wilcoxon Signed Rank Test used to check significantly difference for their conceptual understanding scores on the pre-, post-, and retention tests. Next, the quantitative content analysis including five categories (given in the Table 2) based modification from She and Liao (2010).
Table 3. Quantitative Analysis Categories
Category
Representation
Progress (PG)
coverage the student's conceptions improved
Maintain-Correct (MC)
degree to which the student's conceptions be maintained correctly
Maintain-Partial Correct (MPC)
degree to which the student's conceptions be maintained as partially correct
Maintain-Incorrect (MIC)
degree to which the student's conceptions be maintained as partially incorrect
Retrogression (RG)
degree to which the student's conceptions retrogressed
However, analysis representation of the change of students' conceptual understanding as elicited in students' written responses. The number of conceptual change was described by respective percentages for PG, MC, MPC, MIC, and RG from pretest to posttest and from posttest to retention test.
Copyright (C) 2017 EdUHK APFSLT. Volume 18, Issue 2, Article 12 (Dec., 2017). All Rights Reserved.