 |
Asia-Pacific Forum on Science Learning and Teaching, Volume 18, Issue 2, Article 6 (Dec., 2017) |
The data indicates that, even though STEM education policy has been launched in Thailand in 2013, only 14% of participants had received information about STEM education before attending the IPST-STEM workshop and 85% never heard of STEM education through any media or other channels. Among those familiar with STEM education, the internet was the most accessible and powerful channel that allowed teachers to know about STEM education and become familiar with it.
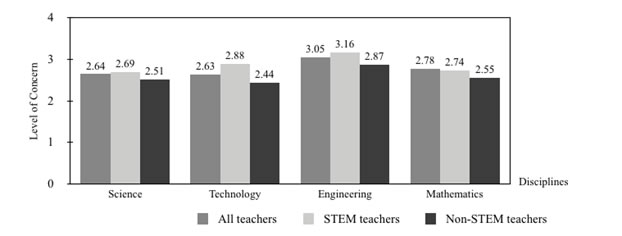
Overall, teachers expressed moderate to strong concern about teaching STEM (2.44 to 3.16 out of 4). The discipline about which teachers expressed the most concern was Engineering (3.05 out of 4). Teachers expressed lower levels of concern about mathematics, technology and science, at 2.78, 2.63, and 2.64, respectively.
Teachers’ concerns about teaching STEM, based on teaching subject, age, and teaching level . When we grouped teachers by teaching subjects, we found that teachers of STEM-related subjects had a higher level of concern for STEM education than teachers who teach non-STEM related subjects (Figure 3).
Figure 3. Teachers’ concerns about STEM disciplines by teaching subject.
The age range of each group was analyzed using a one-way ANOVA to compare means. The results showed no significant differences between age groups (p > 0.05), however we noted some interesting patterns in the data. For example, teachers in the group aged 21–30 years old had stronger concerns about each discipline of STEM than other groups. In mathematics and engineering disciplines, teachers aged between 41–50 and those above 50 year old had lower concern than the groups of teachers aged 21–30 and 31–40 years old. However, teachers aged 31–40 years old seemed to have more confidence overall about all STEM disciplines except engineering (Table 2).
Table 2. Teachers’ concerns for STEM education grouped by age range.
Age RangeLevel of Concern
Science
Mathematics
Engineering
Technology
21–30
(n =35)Mean
2.80
2.69
3.14
3.00
Std. Deviation
1.02
1.02
0.85
1.00
31–40
(n=49)Mean
2.53
2.65
3.14
2.65
Std. Deviation
0.79
0.75
0.82
0.78
41–50
(n=25)Mean
2.68
2.64
2.92
2.76
Std. Deviation
0.95
0.70
0.86
0.97
Above 50
(n=37)Mean
2.59
2.54
2.89
2.70
Std. Deviation
1.01
0.96
0.91
0.91
Total
(n=146)Mean
2.64
2.63
3.04
2.77
Std. Deviation
0.93
0.86
0.85
0.90
Additionally, teaching levels affected in-service teachers’ concern level regarding STEM disciplines. Similar to age groups, the results showed no significant differences between teaching levels (p > 0.05). However, lower primary (grades 1–3) and lower secondary (grades 7–9) teachers tended to have stronger concerns. Lower primary and lower secondary teachers reported a concern of 2.93 and 2.95 for technology while kindergarten, upper primary, and high school teachers reported concern levels of lower concern level at 2.60, 2.69, and 2.63, respectively (mean = 2.78). All participants reported a strong interest in STEM education (mean = 3.93, SD = 0.385).
Teachers were grouped according to teaching subject: science (S), mathematics (M), science and mathematics (SM), STEM-related (e.g., agriculture, computer, and technology), and non-STEM. The findings showed that teachers of STEM-related subjects had a higher concern level in all disciplines of STEM (mean = 3.00 –3.63). While, science teachers held lower concern levels than the others (Table 3). However, a post-hoc pairwise comparison test did not show significant differences between the groups (p > 0.05). SM teachers indicated moderate concern in science, mathematics, and technology disciplines. All groups showed quite strong concerns in engineering (mean = 3.16). In contrast, science seems to be the discipline with the lowest concern level among discipline of STEM teachers (mean = 2.69).
Table 3. Teachers’ concerns for STEM education grouped by teaching subjects.
Teaching SubjectLevel of Concern
Science
Mathematics
Engineering
Technology
Science
(n=44)Mean
2.6
2.7
3.1
2.8
Std. Deviation
1.1
0.9
0.9
1.0
Math
(n=22)Mean
2.9
2.7
3.1
3.1
Std. Deviation
0.9
1.0
0.8
0.8
Science and Math
(n=14)Mean
2.6
2.6
3.4
2.8
Std. Deviation
0.5
0.5
0.7
0.6
STEM-
Related
(n=8)Mean
3.1
3.1
3.6
3.0
Std. Deviation
0.8
0.6
0.5
1.1
Total
(n=88)Mean
2.7
2.7
3.2
2.9
Std. Deviation
1.0
0.8
0.8
0.9
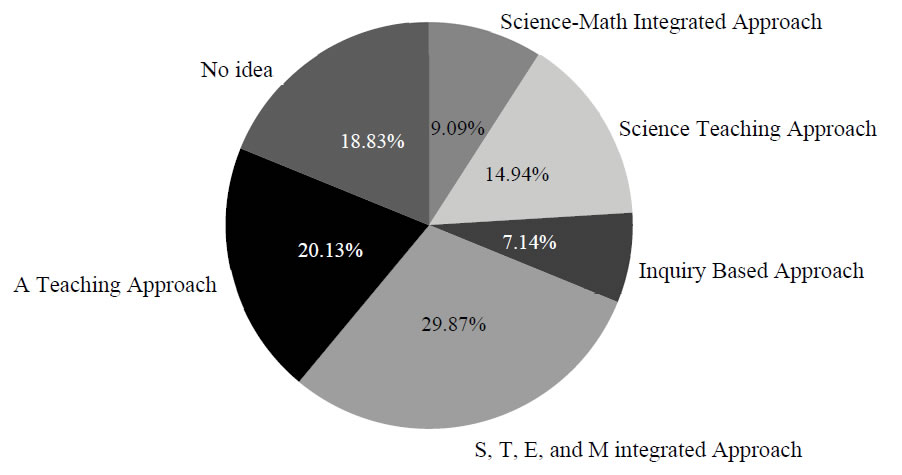
The findings show that 81% of teachers were able to articulate a definition of STEM, while 19% could not (Figure 4).
Figure 4. Teachers’ understanding of what STEM education is.
About 30% of in-service teachers defined STEM education as an integrated STEM-disciplines course or a program to solve problems. The example of their ideas is as:“STEM education is a teaching approach that integrates science, mathematics, engineering, and technology to solve real-life problem.”
About 20% of the in-service teachers indicated that STEM education is an approach for teaching. The example of their ideas is as:
“STEM education is a teaching approach” and “STEM education is an approach that integrates several types of knowledge for learning.”
Nearly 15% defined STEM education as an approach in which students mainly applied science (with or without other disciplines) to solve problems or find answers. The example of their ideas is as:
“STEM education is a science-teaching approach that mixes with other concepts to solve specific problems and find answers” and “STEM education is a teaching approach in which students apply science concepts to solve problems.”
About 9% of in-service teachers defined STEM education as an approach that focuses on the integration of science and mathematics to guide students’ learning. The example of their ideas is as:
“STEM education is an integrated science-and-mathematics teaching approach in which students learn from doing projects.”
Around 7% defined STEM education as an inquiry-based approach that emphasizes learning by doing and finding one’s own answers. The example of their ideas is as:“STEM education is a teaching approach that uses the inquiry process to engage students’ learning.”
Although there is not a single correct approach for STEM integration, we wanted to understand the perceptions that represent our context. In this study, we asked participants to select STEM-education perception models (defined by Bybee, 2013) that best match their perception. Teachers also could express their own ideas and models in addition to the given models. The findings, based on 302 responses, indicated that the majority (20%) viewed STEM education as a transdisciplinary course or program and only 2.32% viewed STEM as a teaching approach in which science is a core concept and other subjects are minor components. This indicates that teachers hold a verity of perceptions regarding STEM integration. The majority of teachers believe STEM concepts should be taught and as a transdisciplinary course in which science, mathematics, engineering, and technology concepts are integrated homogeneously. AT the same time, the same person can view STEM as overlapping across disciplines, such that the teacher must teach STEM concepts together via specific themes or activities. However, we strongly believe that more STEM integration perceptions remain, and we insist that more research should be done on teachers’ beliefs and knowledge related to teaching practices in the context of the classroom. This sort of information will allow us to understand the connection between what teachers think and what they do.
Table 4. Teachers’ STEM-perceptions models (details in Appendix A).
Integration
ModelNo.1
No.2
No.3
No.4
No.5
No.6
No.7
No.8
No.9
Total
Frequency
33
39
7
36
41
28
13
43
62
302
Percentage
10.93
12.91
2.32
11.92
13.58
9.27
4.30
14.24
20.53
100.00
![]()
![]()
![]()
Copyright (C) 2017 EdUHK APFSLT. Volume 18, Issue 2, Article 6 (Dec., 2017). All Rights Reserved.