|
Asia-Pacific Forum on Science Learning and Teaching, Volume 18, Issue 2, Article 3 (Dec., 2017) |
|
Asia-Pacific Forum on Science Learning and Teaching, Volume 18, Issue 2, Article 3 (Dec., 2017) |
The total number of respondents included 345 individuals who were either teachers (48-13.91%) or students (297-86.09%) involved in vocational science education in Thailand’s Region 3 in Phitsanulok Province. Table I and Figure 2 show the results of performance evaluation of integrated scientific process skills of vocational certificate education. According to Table I, the authentic performance of integrated scientific process skills was found to be at a medium level (X̄=3.19, S.D. =0.25), with expected performance at a high level (X̄=4.12, S.D. =0.52).
Table I. Mean (X̄) and Standard Deviation (S.D.) of Authentic and Expected Performance of Integrated Scientific Process Skills
Authentic
Expected
Dependent variables
X̄
S.D.
results
X̄
S.D.
results
1.Formulating Hypotheses
3.08
0.45
Medium
4.11
0.57
High
2.Defining Operationally
3.24
0.32
Medium
4.09
0.58
High
3.Identifying and Controlling Variables
3.21
0.52
Medium
8.66
4.13
High
4.Experimenting
3.05
0.58
Medium
4.14
0.59
High
5.Interpreting and Making Inferences
3.35
0.57
Medium
4.15
0.58
High
Totals
3.19
0.25
Medium
4.12
0.52
High
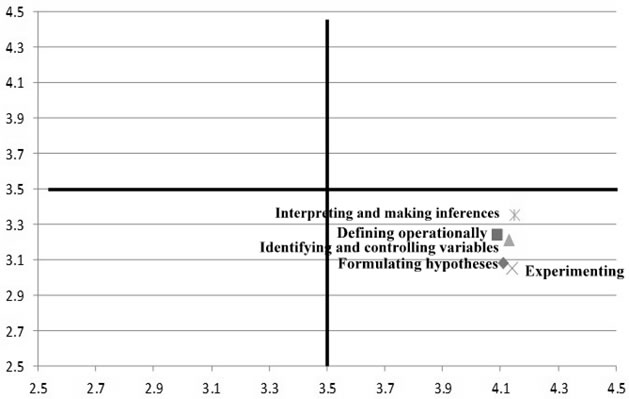
The needs assessment analysis of integrated scientific process skills of vocational certificate students is shown in Figure 3. According to Figure 3, it is shown that the needs assessment of 5 integrated scientific process skills (formulating hypotheses, defining operationally, identifying, and controlling variables, experimenting, and interpreting and making inferences) fall in Quartile 3 which need an urgent improvement.
Figure 3. Needs assessment analysis of integrated scientific process skills.
Prioritizing needs assessment of integrated scientific process skills of vocational certificate students is shown in Table II. According to Table III, it was found that PNI(Modified) appears between 0.23-0.35 which identified the following skills targeted for improvement. From weakest to strongest, it was determined that experimenting was the weakest. However, formatting hypotheses was a bit better. Interpreting and making inferences, identifying, and controlling variables and defining operationally, were next in their order of need for improvement.
The comparison of needs assessment of integrated scientific process skills of vocational certificate students classified by institution type is shown in Table III. According to Table III, it was found that needs assessment of integrated scientific process skills of vocational certificate students in technical colleges, vocational colleges, polytechnic colleges, and industrial and community colleges are not different, as confirmed by a significance level of 0.05. When comparing all the integrated scientific process skills, the results show that all skills need significant improvement.
Model assessments are accomplished with the use of fit statistics, and in regression modeling, R2 is commonly used. The R2 is a descriptive index, and the evaluation of goodness-of-fit is somewhat subjective as where is R2 good? R2= 0.50? R2 = 0.30? R2 = 0.10? There are no fixed guidelines for R2, thus it is desirable to supplement it with the F-test used in Table III (Iacobucci, 2009). The F statistic tests the null hypothesis because it comes with a corresponding statistical distribution. Thus, the F-test tells us whether the model is capturing a significant amount of variance.
Table II. Assessment Results and Prioritizing of Needs Assessment of Integrated Scientific Process Skills of Vocational Certificate Students.
Items
Integrated scientific process skills
I
D
PNI(Modified)
Prioritizing
1
Formatting hypotheses
4.11
3.08
0.33
2
2
Defining operationally
4.09
3.24
0.26
4
3
Identifying and controlling variables
4.13
3.21
0.28
3
4
Experimenting
4.14
3.05
0.35
1
5
Interpreting and making references
4.15
3.35
0.23
5
Total
4.12
3.19
Table III. Comparsion of Needs Assessment of Integrated Scientific Process Skills of Vocational Certificate Students (Classified by Institutions).
Integrated Scientific Process Skills
Source of Variance
SS
df
MS
F
Sig
1. Formatting hypotheses
Between Groups
Within Groups
Total
0.831
71.005
71.8365
339
3440.166
0.2090.793
0.555
2. Defining operationally
Between Groups
Within Groups
Total
0.631
35.621
36.2525
339
3440.126
0.1051.201
0.308
3. Identifying and controlling variances
Between Groups
Within Groups
Total
2.605
90.643
93.2485
339
3440.521
0.2671.949
0.086
4. Experimenting
Between Groups
Within Groups
Total
2.731
116.589
119.3215
339
3440.546
0.3441.588
0.163
5. Interpreting and making inferences
Between Groups
Within Groups
Total
1.988
110.383
112.3715
339
3440.398
0.3261.221
0.299
Total
Between Groups
Within Groups
Total
0.252
21.364
21.6165
339
3440.050
0.0630.801
0.550
Table IV also shows items from the questionnaire along with their results.
Table IV. Questionnaire items for Level of Need.
Item
Mean
SD
Level of Need
The assumptions.
1. I can understand the assumptions from the problem set.
4.58
0.560
most
2. I can understand the rules of the assumption.
4.42
0.540
much
3. I can tell how to test assumptions from the given data.
4.39
0.551
much
The definition of action.
much
1. I can define the meaning and scope of words
4.38
0.532
much
2. I can define the action of a word or variable.
4.57
0.557
most
3. I can improve the definition of action.
4.35
0.524
much
Defining and controlling variables
1. I can control the parameters that are set and the assumptions made.
4.38
0.547
much
2. I can define the dependent, independent, and control variables.
4.40
0.501
much
3. I can tell and control the conditions and circumstances of either the constant or non-constant variables.
4.40
0.557
much
The trials.
much
I can decide the design of each experiment.
4.35
0.526
much
2. I can follow the experiment’s plans.
4.38
0.503
much
3. I take note of each experiment and its results.
4.39
0.539
much
Interpretation of information and conclusions.
much
1. The interpretation of results is very clear and conclusive.
4.39
0.551
much
2. I can interpret or describe the properties of the data.
4.39
0.566
much
3. I can describe the meaning of the information provided in different ways.
4.40
0.531
much

Copyright (C) 2017 EdUHK APFSLT. Volume 18, Issue 2, Article 3 (Dec., 2017). All Rights Reserved.