|
Asia-Pacific Forum on Science Learning and Teaching, Volume 18, Issue 2, Article 14 (Dec., 2017) |
The findings obtained from the research are given below. The Electric Current Achievement Test (ECAT) pretest scores of the students of the experimental group in which the lesson was studied according to the 5E model and the students of the control group in which the lesson was taught according to the traditional teaching method were compared by using the independent t-test and the results are given in Table 1.
Table 1. Results of t-Test Related to the ECAT Pretest Scores of the Students in the Experimental and Control Groups
Measurement N
X
Std. Dev.
df
t
p
Pretest (Control)
33
5.55
1.986
60
-.309
.758
Pretest(Experimental)
29
5.76
3.345
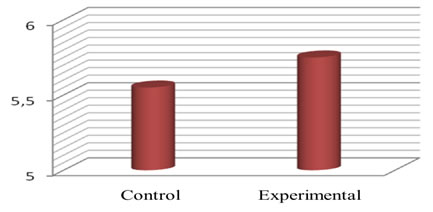
As it can be seen in Table 1, there is not a meaningful difference between the pretest scores of the experimental and control groups (p= .758 >0.05). Accordingly, it is likely to say that both groups were close to each other before studying the topic.
Figure 1. ECAT pretest mean value
Electric Current Achievement Test (ECAT) posttest scores of the experimental and control groups were compared by means of independent t-test and the results are given in Table 2.
Table 2. Results of the t-Test Related to the ECAT Posttest Scores of the Students in the Experimental and Control Groups
Measurement
N
X
Std. Dev.
df
t
p
Posttest (Control)
33
8.21
2.190
60
-7.150
.002
Posttest(Experimental)
29
14.07
4.088
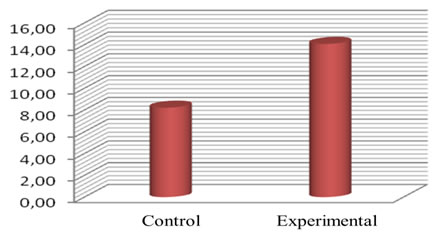
Table 2 shows that there is a considerable difference between the posttest scores of the control group and the experimental group (p= 002 <0.05). In the post test, the experimental group was more successful than the control group.
Figure 3. ECAT posttest mean values
Independent t-test analysis was conducted in order to understand whether there is a meaningful difference between the pretest and posttest scores of the students in the experimental and control groups.
Electric Current Achievement Test (ECAT) pretest and posttest scores of the students in the experimental group were compared using dependent t-test, and they were given in Table 3.Table 3. Results of the t-Test Related to the ECAT Pretest and Posttest Scores of the Students in the Experimental Group
Measurement
N
X
Std. Dev.
df
t
p
Pretest (Experimental)
29
5.76
3.345
28
-12.019
.000
Posttest (Experimental)
29
14.07
4.088
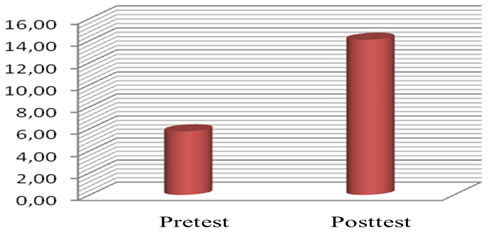
As it can be seen in Table 3, there is a significant difference between the pretest-posttest scores of the experimental group (p= . 000 <0.05). Students in the experimental group were more successful in the posttest in comparison with the pretest.
Figure 5. ECAT experimental group mean values
The results of the t-test related to ECAT pretest-posttest scores of the students in the control group are given in Table 4.
Table 4. The Results of t-Test related to the ECAT Pretest-Posttest Scores of the Students in the Control Group
Measurement N
X
Std. Dev.
df
t
p
Pretest (Control)
33
5.55
1.986
32
-7.188
.000
Posttest(Control)
33
8.21
2.190
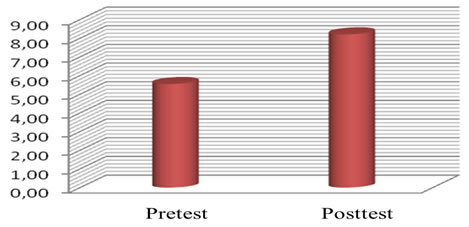
When Table 4 is examined, it is seen that there is a meaningful difference between the pretest and posttest scores of the control group (p =. 000 <0.05). The control group was more successful in the posttest in comparison with the pretest.
Figure 6. ECAT control group mean values
When the groups are compared, it is seen that ECAT pretest score mean of the experimental group is 5.76, pretest score mean of the control group is 5.55. Posttest score means of the experimental and control groups are 14.07 and 8.21 respectively. As it is seen here, there is not a meaningful difference between the pretest scores of the groups but there is a significant difference on behalf of the experimental group in terms of posttest scores.
The Results of the Attitude Scale
The attitude scale used in the research has 3 subfactors. These subfactors are “affection”, “interest” and “importance of physics in daily life”. The results of the scale were evaluated by using t-test according to these factors. The results obtained from these subfactors are given below.
Examination of “affection” subfactor
Pretest scores of the experimental and control group students related to “affection” subfactor were compared using independent t-test and the results are given in Table 5.Table 5. Results of the t-Test related to the “Affection” Subfactor of the Students in the Experimental and Control Groups
Pretest Groups
N
X
Std.Dev.
df
t
p
Affection
Control
33
25.33
6.392
60
1.033
.878
Experimental
29
23.76
5.495
According to the Table.5, there is not a significant difference between the pretest scores related to the “Affection” subfactor of the students in the experimental and control groups (p =. 878 >0.05). Posttest scores related to the “Affection” subfactor of the students in the experimental and control groups were compared by means of independent t-test and the results are displayed in Table 6.
Table 6. Results of the t-Test related to the Posttest Scores Belonging to the “Affection” Subfactor of the Student in the Experimental and Control Groups
Posttest Groups
N
X
Std. Dev.
df
t
p
Affection
Control
33
24.36
7.176
60
.226
.738
Experimental
29
23.97
6.598
As it can be seen in Table 6, there is not a significant difference between groups (p>0.05). This result shows that there are no changes in the attitudes of the students in terms of “affection” subfactor.
Examination of “Interest” Subfactor
Pretest scores of the experimental and control groups related to the “Interest” subfactor were compared using independent t-test and the results are given in Table 7.Table 7. Results of the t-Test related to the Pretest Scores Belonging to the “Interest” Subfactor of the Students in the Experimental and Control Groups
Pretest
Groups
N
X
Std. Dev.
df
t
p
Interest
Control
33
11.67
2.723
60
-1.169
.450
Experimental
29
12.52
3.007
According to Table 7, there is not a considerable difference between the pretest scores of the experimental and control groups related to the “Interest” subfactor of the attitude scale (p=. 450 >0.05). Posttest scores related to the “Interest” subfactor of the experimental and control groups were compared by using independent t-test and the results are given in Table 8.
Table 8. Results of the t-Test related to the Posttest Scores Belonging to the “Interest” Subfactor of the Students in the Experimental and Control Groups
Posttest Groups
N
X
Std. Dev.
df
t
p
Interest
Control
33
11.45
2.862
60
-.837
.558
Experimental
29
12.10
3.244
According to Table 8, as the significance level is (p>0.05), there is not a meaningful difference between the groups. It is possible to say that this study could not make a meaningful difference in the attitudes of the students in terms of “interest” subfactor.
Examination of “importance of physics in daily life” subfactor
The pretest scores of the experimental and control groups related to the “importance of physics in daily life” subfactor were compared by using independent t-test and the results were given in Table 9.Table 9. Results of the t-Test related to the Pretest Scores of the Students in the Experimental and Control Groups in terms of “importance of Physics in daily life” Subfactor
Pretest Groups
N
X
Std. Dev.
df
t
p
Importance of Physics in
Control
33
21.94
2.715
60
2.314
.114
Experimental
29
20.14
3.409
When Table 9 is examined, it is seen that there is not a significant difference between the pretest scores of the experimental and control groups in terms of “importance of physics in daily life” subfactor (p>0.05). The posttest scores of the experimental and control groups related to the subfactor “importance of physics in daily life” were compared using independent t-test and the results are given in Table 10.
Table 10. Results of t-Test related to Posttest Scores of the Students in the Experimental and Control Groups in terms of Subfactor “Importance of Physics in Daily Life”
Posttest Groups
N
X
Std.Dev.
df
t
p
Importance of Physics in
Control
33
22.18
3.015
60
2.144
.214
Experimental
29
20.41
3.480
As the significance level is (p>0.05) according to Table 10, no significant differences were determined between groups. It is possible to say that this study did not make any differences in student attitudes in terms of “importance of physics in daily life” subfactor.