 |
Asia-Pacific Forum on Science Learning and Teaching, Volume 18, Issue 2, Article 13 (Dec., 2017) |
This study is descriptive in nature and qualitative research methodology. Qualitative methodology was used to address the research questions (Büyüköztürk et al., 2013).
The study was conducted in spring semester of 2009-2010 academic year after Health Concept Unit in the Health Education Course that was one hour a week, had been taught in fall semester of 2009-2010 academic year. Participants consisted of 81 ninth grade students (46 male and 35 female) in three classrooms in a Technical and Industrial Vocational School in Kocaeli, Turkey. Participants were selected by using by convenient sampling method, which is one of purposeful sampling methods (Büyüköztürk et al., 2013). The questionnaire was filled by 81 volunteer students.
Data Collection and Data Analysis
In this study, the drawing and writing techniques were used to determine students’ views about disease concept. This technique is one of the significant techniques frequently used to reflect students’ views (Rennie and Jarvis, 1995; Çetin et al., 2013).
The students were asked to respond a questionnaire including “What is disease? Explain and draw.” on A4 sheet in 5 minutes. They were told that it was not an exam but an explorative activity. Students were explained that it was important to complete the task on their own. The students were given a short period to complete drawing and writing activity in order to prevent them from cheating. Also, the students were told to express their thoughts openhandedly and should not restrict themselves.
Data were analyzed based on descriptive and content analysis techniques (Yıldırım and Şimşek, 2006). Content analysis is conducted “to discover the concepts and relations that will be able to explain data. Therefore, data that are similar to each other are categorized within the frame of particular concepts and themes and they are organized and interpreted in a way that the reader can understand the data” (Yıldırım and Şimşek, 2006, p. 227).
Before starting data analysis, the students’ answer sheets were numbered from 1 to 81. Example of three answer sheets of the students has been presented in Figures 1-3.
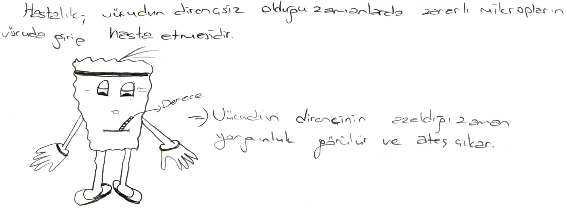
Figure 1. Answer sheet of S9 (Illness is the germ’s making someone sick by penetrating into the body when it the body is resistless. When the resistance of the body decreases, fatigue and high fever are observed.)
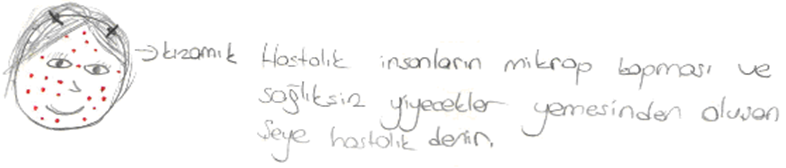
Figure 2. Answer sheet of S60 (Measles. Catching an infection and the condition in which you eat unhealthy food are named as illness.)
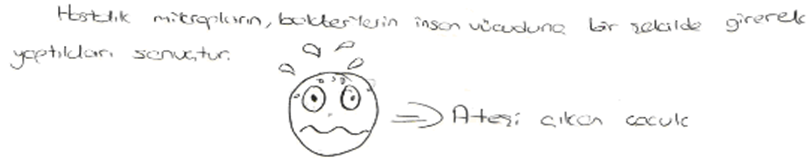
Figure 3. Answer sheet of S48 (Illness is the result of germs and bacteria through their getting into the body somehow. A boy with fever.)
Explanations and drawings about disease concept in each answer sheet were analyzed separately by the authors of the article. Firstly the student’s explanations about the definition of disease concept were categorized under specific themes and sub-themes for the explanation part. Students’ drawings about the definition of disease concept were also analyzed similarly. After comparing the results of the analysis, the authors came to an agreement. Thus, the internal consistency of the themes and sub-themes created in the study was achieved by the authors of the article. Themes and sub-themes were checked many times by the authors. Then, the final version of it was obtained (see Table 1).
In addition, remarkable students’ explanations about disease were given in the text by making same quote into “ … ” by student number in the text such as S21 and S66. Examples have been presented to drawings of students related to disease by indicating student number too.
