|
Asia-Pacific Forum on Science Learning and Teaching, Volume 18, Issue 2, Article 1 (Dec., 2017) |
This study is a quantitative research employed the one group pre-test post-test research design. The research process is consisted of three stages: a) Development of simulation and game on photoelectric effect, b) Implementation of simulation and game based learning unit to teach photoelectric effect, and c) Investigation of effectiveness of the learning unit in enhancing the participating students’ understanding of photoelectric effect and attitudes towards the learning unit.
Development of photoelectric effect simulation
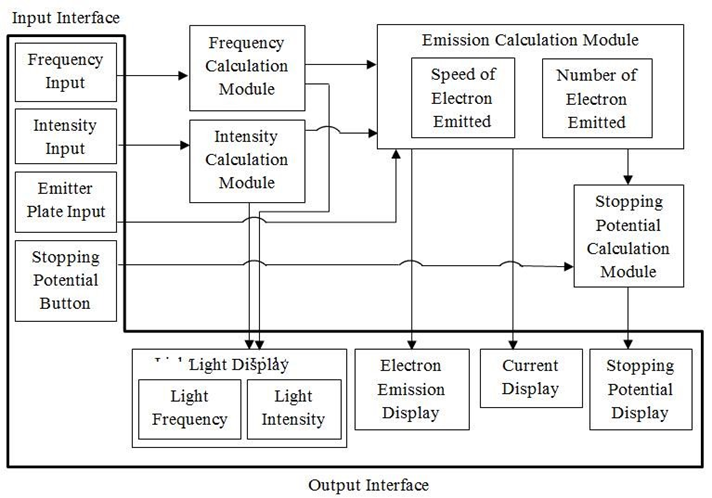
Macromedia Flash 8.0® was used to develop the simulation in this study because it is compatible with Windows®, which is the operating system commonly used in school computers in Bhutan, and gives a room for creating an animation and a configuration using action script 2.0. Figure I shows the structure of system used in designing the photoelectric effect simulation.
Figure I. Structure of system used in photoelectric effect simulation
The interactive simulation is developed to simulate the laboratory experiment on photoelectric effect. McKagan et al. (2009) suggest that, to increase the efficiency of learning, the subtle complications being irrelevant to the learning goal should be reduced or set as an assumption. Therefore, the following assumptions were made while developing the simulation in this study: a) the simulated photoelectric set up is 100 percent efficiency that every photon emits a photoelectron and the collector plate is large enough to collect all emitted electrons, and b) all photoelectrons will be emitted perpendicular to the emitter plate so that photocurrent remains the same even if the applied voltage is increased (Foong, Lee, Wong, & Chee, 2010).
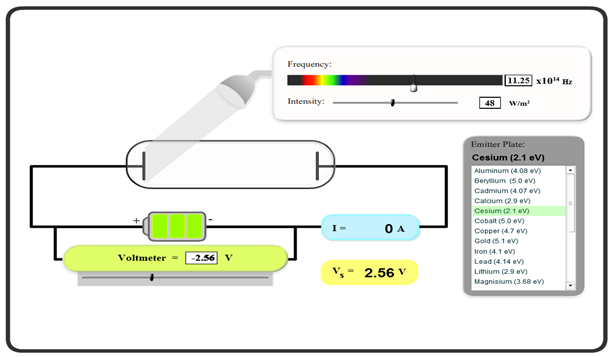
There are four inputs presented in the simulation: a) Intensity slider, b) Frequency slider, c) Emitter plate list and d) Potential slider. These inputs aimed for adjusting the potential between the plates inside the vacuum tube as shown in Figure 2. The simulation allows a student to control the inputs such as the intensity and frequency of light and the electrodes used in the experiment.
Figure II. Simulation on photoelectric effect
Based on the inputs, this simulation can give outputs like an amount of current produced by photoelectric effect and the simulation of emitted electrons in terms of numbers and speed, which might vary according to the input variables. The input variable of light consists of frequency of light in Hertz (Hz) and intensity of light in watt per square meter (W/m2). The student can vary the input regarding light either by moving a slider or punching the values.
Another input variable is electrodes used in the photoelectric effect experiment, which are consisted of 23 metals. The student can choose the lowest work function metal to the highest work function metal, which are Cesium with 2 electron volts (eV) and Platinum with 6.35 eV, respectively. The simulation of emitted electrons as per the input variables can help student deduce the relationship between the frequency of light and intensity of light with respect to the emission of photoelectrons. The potential of the cells can be varied and if the potential is reversed or negative, then at certain negative potential emitted electrons will be completely repelled by the collector plate, which will be at negative potential and the current will be reduced to zero. It is called stopping potential (Vs), which is equal to maximum kinetic energy of the emitted electrons. The data from simulation can be used to plot maximum kinetic energy versus frequency in order to find Plank’s constant. This is particularly important since it gives a picture of how light interacts with electron on electrodes, which depends on the frequency instead of the intensity of light and thereby giving the concept of photons.
The salient feature of this simulation is that the student can input the value of intensity in watt per meter square (W/m2), unlike the previous works where an arbitrary value is given or is calculated in percentage (McKagan et al., 2009; Steinberg & Oberem, 2000). The simulation in this study can be correlated with the magnitude of output current. Similarly, when the intensity is kept constant and the frequency is increased, the magnitude of the current will decrease since the photon flux will decrease thereby decreasing the number of photoelectrons emitted (Angier, 2008; Khoon, 2011). This gives further evidence that particle nature of light call “a photon”.
Another unique feature of this simulation is the way stopping potential is found. This simulation uses reverse potential slider to accurately find the stopping potential because the reading pops up when slider crosses stopping potential. In case of previous simulations, a student had to slide it with dexterity and very careful observation has to be made on the output current gauge to get an accurate stopping potential (McKagan et al., 2009).
Development of photoelectric effect game
The photoelectric effect game is developed on a board game framework by using Macromedia Flash 8.0®. Figure III shows the structure of system used in designing the photoelectric effect game.
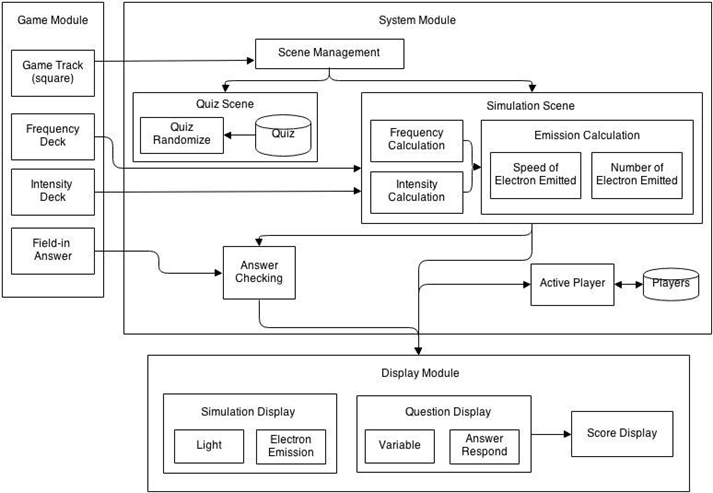
Figure III. Structure of system used in photoelectric effect game
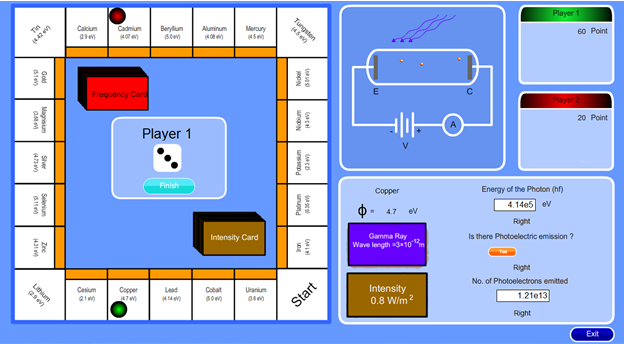
The maximum number of players for the photoelectric effect game is two. To play game, Player 1 starts by rolling a dice and then the system will randomly generate one integer ranged from one (1) to six (6) and present on the dice face. The player’s token then will move in clockwise direction to the rectangle block on the board as per the number appeared on the dice. Each block on the board has a specific type of metal presented with its work function in electron volt (eV). Next, Player 1 has to pick a frequency card, which will cause light wave with distinct color to strike on an emitter plate on the simulation panel of the game. On the frequency card, the players may be given the frequency of light or sometimes they will be given the wavelength and must convert it to the frequency. When Player 1 got the frequency card, he or she has to calculate the energy of photon in eV and put his or her answer in the box provided. Player 1 will get two points (+2) for the correct answer and minus two points (-2) for the incorrect one. Then, Player 1 will be asked whether there will be an emission of photoelectrons or not. To answer this, Player 1 has to compare the work function and photon energy and answer the question by pressing “YES” or “NO” button. Subsequently, two points will be awarded or deducted for the correct or incorrect answer, respectively. The emission of photoelectrons will be shown on the simulation irrespective of their answer; this will correct the player’s understanding of photoelectric effect. Next, Player 1 picks an intensity card. Based on the magnitude of intensity, he or she has to calculate the number of electrons emitted. In this simulation, simulated apparatus is considered to be 100 percent efficient and hence one photon will emit one electron. When Player 1 puts the answer, he or she will be awarded or deducted two points as per the correctness of answer.
The speed and number of electrons emitted will depend on the frequency and intensity cards picked by the player. Subsequently, the intensity (represented by number of wave striking), frequency (represented by color of light wave), speed and number of electrons emitted will be displayed in the simulation panel. If the player’s token falls into a quiz block, then a quiz will be popped up with four alternative choices. Player 1 will get +10 points for correct choice or -2 points for the wrong one. The answer with the explanation will be shown irrespective of their answer. This is the first round for Player. Next, Player 2 follows the same procedure and finish his or her first round. Two players will play this game with the same process until the winner has been declared.
This game is a new platform that is developed to motivate student to learn the concept of photoelectric effect. Game was used because by nature game can create immersive environment, where students’ attention can be focused while learning the targeted concepts. For instance, even if the student picks the high magnitude intensity card but has low magnitude frequency card, it will not cause emission of photoelectrons. In this case, players cannot get 10 points for the calculation of number of photoelectrons emitted. Therefore, student would be eager to have high frequency card. This would reinforce the concept of emission of photoelectrons, which depends on frequency rather than intensity of light. It would be further reinforced by the simulation displayed and, at the same time, student would learn how to work through various calculations of photoelectric effect.
Figure IV. Simulation game on photoelectric effect
Five experts with physics and mathematics backgrounds validated content validity of photoelectric effect simulation and game. The index of item-objective congruence (IOC) (Rovinelli & Hambleton, 1977; Turner & Carlson, 2003) showed the experts’ rating on the congruence of individual items with the objective intended by the developer. In overall, the IOC of these simulation and game ranged from .60 and 1.00, which were in the acceptance level.
Implementation of simulation and game based instruction on photoelectric effect
The photoelectric effect simulation and game are embedded with the 5E learning cycle lesson plan (see Appendix). In Engagement stage, the teacher poses the questions related to energy of wave by using examples from everyday lives, for example, the similar impact of two waves with the same intensity originated from two sources located in different distances from an object. Also, the teacher asks students to determine the factor affecting the energy of two waves with different intensities. Next, the teacher presents the pictures of two light sources with different intensities and asks students to explain the difference of energy of those light sources. Then, the interference patterns of light and water waves is shown and students are asked to explain how interference is formed. These activities aim to engage and explore students’ prior knowledge of wave and light as wave. At the end of Engagement, the teacher requires students to observe the photoelectric effect simulation in order to promote students’ curiosity about an instantaneous emission of electrons despite the wave energy being distributed along the wave front. Students’ understanding moves in various directions therefore at exploration phase, adequate and scientifically accurate concept should be initiated like giving concrete activities. The Exploration stage is suitable for using computer simulation to concretize their learning experiences (Bybee et al., 2006). Therefore, the photoelectric effect simulation is used to develop a common experience, which will be discussed in Explanation phase. There are two major activities to be carried out in exploring the photoelectric effect simulation. The goal of Activity 1 is to make students realize that the photoelectric effect phenomenon is not consistent with the wave model of light and it can be explained only when light is considered as a packet of energy (called photon). Activity 1 helps students understand about the relationship between the intensity of light and the frequency of light in the photoelectric effect phenomenon. Then, Activity 2 is used for students to find the magnitude of that packet of energy, which depends on the frequency of light and is integral multiples of Plank’s constant. Activity 2 helps students derive the Plank’s constant and understand the photon concept of light. In Explanation phase, the teacher probes students’ understanding through various questions and asks them why the photoelectric effect phenomenon cannot be explained with the wave nature of light. Then, the teacher explains the concept in direct, explicit and formal manner. In Elaboration phase, Activity 3 is used and required students to use and generalize their learned concept from the previous phases in playing the photoelectric effect game. In Evaluation phase, students are evaluated for their conceptual understanding of photoelectric effect and their attitudes towards the photoelectric effect learning activities. However, informal evaluation is taken placed throughout all stages of 5E learning cycle.
The participants of this research were 31 students in one grade 12 class in Bhutan. This is a typical class where all students share the same space, can identify each other, and interact with their classmates in daily classroom activity (McMillan, 2004). All participants were familiar with basic operation of computer. The photoelectric effect class took five hours.
Data collection and research instruments
There were four methods to collect data in this study: conceptual test, attitude survey, interview, and reflective journal. The data collected were both quantitative and qualitative. Before the photoelectric effect class, the participants were asked to respond to the Photoelectric Effect Conceptual Evaluation Test (PECE). This data served as a pre-test. At the end of the class, the participants responded to PECE again as a post-test and also the Multimedia Attitude Survey (MAS). One day after the class, all participants were asked to write their reflective journals according to teaching and learning in the photoelectric effect class. Also, the researchers interviewed the participants randomly. The instruments used in this study can be described as follows.
Photoelectric Effect Conceptual Evaluation Test (PECE)
This study adopted PECE developed by Sura Wuttiprom, Ratchapak Chiaree, Chernchok Soankwan, Kwan Arayathanitkul, and Naumon Emmarat (Cited in Wuttiprom 2008). PECE consists of 30 test items, which divided into seven constructs: a) Electromagnetic (EM) model of light, b) Photon model of light, c) Characteristic of photon d) Threshold frequency, e) Work function, f) Maximum kinetic energy, and g) Stopping potential. To check the reliability of PECE, the researchers administered PECE to one grade 12 class with 30 students, who were not the participants in this study. The reliabilities of PECE constructs ranged from .69 to .95.
Multimedia Attitude Survey (MAS)
The Multimedia Attitude Survey (MAS) is a multidimensional tool to assess student’s attitudes towards multimedia-based instruction (Fco & Garcia, 2001). MAS consists of 25 items, which divided into eight dimensions. In this study, the five items in the dimension of “Students’ attitudes toward the learner’s control over the instructional process” were excluded. Consequently, there were 20 items of MAS used in this study. The reliability of MAS was established by the try out process with the same class of students as being occurred with PECE. The reliabilities of MAS dimensions ranged from .68 to .84, which were in an accepted range (Gliem & Gliem, 2003).
Interview
Of all participants, 20% were randomly interviewed after the photoelectric effect class by using the same interview protocol (see Appendix). The interview protocol was used as a guide for the researchers to maintain the focus of interview and as markers for the interview to follow (Dilley, 2000). The protocol was incorporated with the prompts to remind the interviewer to further probe for in-depth information from the participants, which was the focus of study (Jacob & Furgerson, 2012).
Reflective journal
After attended the photoelectric effect class, the participants were required to write their reflective journals to reflect upon contents, teaching, and learning in the class including the photoelectric effect simulation and game. The reflective journal can provide clues to important circumstances faced by the participants and their attitudes toward those circumstances (Jacelon & Imperio, 2005).
The quantitative data was analyzed by using the statistical package of SPSS®. The paired sample t-test was used to analyze the pre-test and post-test mean scores of PECE. The Cohen’s d was also used to determine the effect size of the photoelectric effect class, which was measured by standardizing the difference between the means in terms of standard deviation (SD). Researchers identify that calculated value as ‘estimated Cohen’s d’ (Wallnau & Gravetter, 2005). Thus, the estimated Cohen’s d was used to measure the effect size of this study. The data from MAS was also calculated for mean and SD. In addition, a thematic analysis was employed to analyze qualitative data from interviews and reflective journals. The thematic analysis is started from intensive reading of qualitative data, then the important sections in the data are labelled and given a name or code. The similarly emerged codes will be grouped into a category. All emerged categories will be reviewed in order to find out the pattern or theme of findings. (Braun & Clarke, 2006).