 |
Asia-Pacific Forum on Science Learning and Teaching, Volume 18, Issue 1, Article 7 (Jun., 2017) |
Regarding the motivation of students to learn GO, the finding of this study showed that before the intervention, students from experimental and control groups obtained almost equivalent mean scores (in the pre-test).
The data collected by the GOIMS in Table 3, indicates that in pre-test before any intervention, there were no large difference scores between students in the experimental group and the control group (M 12.61 Sd 06.79 and M 12.42 Sd 05.06).
Also, table 3 shows that the calculated value of F test (Fcacl) is smaller than a tabulated value (Ftab) with degrees of freedom of 25 (N-1=25). Therefore the two groups present a normal distribution. Since the samples arise from populations with homogeneous variances, the t-test was calculated (table 4).
Table 3. Descriptive statistics related to students` GOIMS and GOUCT scores, in the experimental and control groups
Test
Group
N
Mean
Sd
Fcalc
Ftab(25,25)
Pre- GOIMS
CG
26
12,6154
6,79457
1,34
1,98
EG
26
12,4231
5,06101
Post- GOIMS
CG
26
13,4231
6,95225
1,16
EG
26
22,1923
5,98678
Pre- GOUCT
CG
26
1.8846
1.17735
1,34
EG
26
1.7692
1.58260
Post- GOUCT
CG
26
3.0000
1.52315
1,24
EG
26
4.9231
1.89574
As shown in Table 4, the independent samples t test shows that there was no significant difference in pre-GOIMS mean scores for the EG and control groups [t(50)=0.11, p=0.91]. It means that all students, participating in this study, have the same level of intrinsic motivation.
The mean score for the treatment group increased from the pre-GOIMS (M=12.42, Sd=05.06) to the post-GOIMS [M= 22.19, Sd=05.99; t(25)=6,58, p=0.000]. Although, for the control groups, the post-GOIMS mean score (M=12.61, Sd=06.79) was slightly higher than pre-GOIMS [M=13.42, Sd=06.95; t(26)=1.4, p=0.172], with no significant difference.
Table 4. The samples t test
Groups
GOIMS
t
DF
P
GOUCT
T
DF
P
EG
Pre-Test
6.58
25
0.000
Pre-Test
13.242
25
0.000
Post-Test
Post-Test
CG
Pre-Test
1.4
25
0.172
Pre-Test
10,973
25
0.000
Post-Test
Post-Test
EG
CGPre-Test
0.11
50
0.908
Pre-Test
0.298
50
0.767
Pre-Test
Pre-Test
EG
CGPost-Test
4.87
50
0.000
Post-Test
4.032
50
0.000
Post-Test
Post-Test
Thus, after the intervention, students from the experimental group had obtained higher mean scores for GOIMS compared to the students from the control group (Table 3). The independent samples t test result as summarized in Table 4, was unable to show a significant difference between the groups in post-GOIMS.
To study conception change, we chose a quantitative approach. Based on the data obtained by the GOUCT, the students’ mean and standard deviation of pretest scores for experimental and control groups were shown in Table 3. An independent sample t-test result (see Table 4.) showed that there were no significant differences between the two groups in pre-GOUCT (t = 0.29, p > 0.05). All students in both groups have almost the same number of misconceptions about vision, propagation of light and formation of the image by lens. This indicates that the groups used in the study exhibited comparable characteristics.
Also, the paired sample t tests conducted to evaluate the impact of the interventions on the students’ scores in the GOUCT, were shown in Table 4. There was a statistically significant increase in test scores from pre-test (M=1.77, Sd=1.58) to post-test [M =4.92, Sd=1.89, t(25)= 13.24, p =0.000] for the experimental groups. The students’ understanding concepts of GO in the control groups also showed a statistically significant increase in test scores from the pre-test (M=1.88, Sd=1.18) to the post-test [M=3.00, Sd=1.52, t(25)=10.97, p<0.000].
When the post-test means scores were compared using independent samples t test, it was found that a statistically significant difference between the experimental group (M =4.92, Sd=1.89) and control group (M = 3.00, Sd =1.52) mean scores existed in favor of the experimental group [t(50)=4.03, p <0.05].
The results from the Table 5 show that there was a slight increase in the students GO understanding in the control group, while there was a net increase in the percentage of correct answers given by students in the experimental group after the treatment. For example, in question 3 (about propagation of light in vacuum), the frequency of correct responses was increased from 15% to 42% in EG and from 15% to the 19% in CG.
Table 5. Frequency of correct responses (%) in GOUCT
EG (N = 26)
CG (N = 26)
Pre-GOUCT
Post-GOUCT
Pre-GOUCT
Post-GOUCT
Q1
23
73
27
38
Q2
27
58
27
35
Q3
15
31
19
23
Q4
15
42
15
19
Q5
19
42
15
23
Q6
8
35
8
15
Q7
12
35
15
19
Q8
27
65
23
42
Q9
12
62
15
35
Q10
19
62
15
42
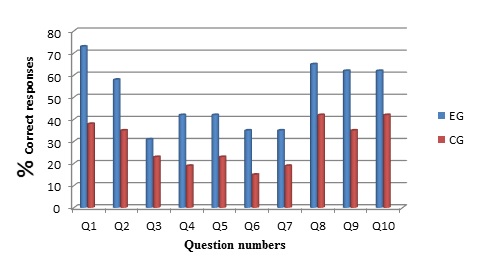
Figure 1. Comparison between post-GOUCT scores of EG and CG
The histogram, in Figure 1, clearly shows the difference between the frequency of correct responses of the experimental group and the control group post-GOUCT after treatment. More than 70% of the students in EG have a correct concept about vision, while almost 60% of students in CG still had misconception about vision, even though they attended courses on OG. It is very clear that the use of our sequence HoS, had a positive effect on understanding GO concepts and eliminated some misconceptions.
Pearson correlations were computed in order to find the relationship between students’ intrinsic motivation and understanding GO concepts. The findings indicated a positive significant correlation between students’ intrinsic motivation and understanding GO concepts (r= 0.812, p ≤ 0.01).
Further analysis was conducted using a regression analysis incorporating students’ intrinsic motivation, as predictor variable. The findings indicated an overall significant effect on students’ understanding GO concepts, F (1,50)=97.118, p<0.01. This result demonstrates that the relation between dependent and independent variables are linear. In the Table 6, it is seen that intrinsic motivation predicts %66 (R2=0.660) of understanding GO concepts. Intrinsic motivation is found to be significant predictors.
Table 6. Results of the regression analysis using the post-test data
Dependent variable
Independent variable
β
Standart error β
r
R2
t
F
Sig. of F
Understanding GO concepts
Intrinsic motivation
0.812
0.021
0.812
0.660
9.855
97.118
.000
![]()
![]()
![]()
Copyright (C) 2017 EdUHK APFSLT. Volume 18, Issue 1, Article 7 (Jun., 2017). All Rights Reserved.