 |
Asia-Pacific Forum on Science Learning and Teaching, Volume 17, Issue 2, Article 4 (Dec., 2016) |
In this study, a total of 749 respondents from eight secondary schools in Penang were involved. The demographic variables of this study were shown in Table 6.
Table 6. Demographic Variables of the Study
Class
Stream
Gender
Total
Percentage
(%)Male
Female
Form 4
Science
138
312
450
60
Form 4
Arts
99
200
299
40
Total
237
512
749
100
Psychometric Properties of ATST
(a) Unidimensionality
Table 7 showed the infit and outfit values for both person and item. Infit Mean-Square (MNSQ) for person is 1.02 and for item is 1.00. Meanwhile, outfit MNSQ for both person and item is 1.02. Besides, infit ZSTD and outfit ZSTD for person is -.3. Meanwhile, infit ZSTD and outfit ZSTD for item are -.1 and .2 respectively.
Table 7. Fit Statistics
Infit
MNSQ ZSTDOutfit
MNSQ ZSTDPerson
Mean
1.02
-.3
1.02
-.3
S.D.
.54
2.4
.54
2.4
Item
Mean
1.00
-.1
1.02
.2
S.D.
.17
3.4
.20
3.7
In this study, reasonable ranges for item mean-square fit statistics used is between 0.6 - 1.4 as suggested by Bond and Fox (2001). Using this criterion, only one item out of 40 items is not in the ranges, which is Item 3: scientists usually like to go to their laboratories when they have a day off.
Table 8. Infit and Outfit of Items that are Not in the Ranges between 0.6 – 1.4
Item
Infit
Outfit
MNSQ
ZSTD
MNSQ
ZSTD
3
1.46
8.2
1.50
8.8
On the other hand, point-biserial correlation (rpb) was examined, as shown in Table 9. Negative or low positive point-biserial correlation indicates that an item is not acting as expected with regard to the underlying construct. In general, item with point-biserial correlation, rpb > .20 is acceptable whereas rpb < 0.15 should be examined for further action. Results of this study showed that point-biserial correlations for all the 40 items are ranging from .40 to .70 (McCormack et al., 2006). This indicates that all items are acting as expected with regard to the underlying construct but not a multidimensional factor structure (Schumacker & Smith, 2007).
Table 9. Point-Biserial Correlations
Item
Measure
Model S.E.
PT-Measure
Item
Measure
Model S.E.
PT-Measure
Cor.
Ex.
Cor.
Ex.
1
.79
.04
.47
.53
21
.20
.04
.47
.53
2
.10
.04
.52
.53
22
.74
.04
.57
.57
3
.46
.04
.30
.55
23
.16
.04
.67
.56
4
-.23
.04
.50
.53
24
-.20
.04
.66
.53
5
-.12
.04
.42
.53
25
-.65
.04
.60
.49
6
.32
.04
.66
.56
26
-.25
.04
.55
.53
7
.41
.04
.62
.57
27
.02
.04
.42
.53
8
-.17
.04
.65
.52
28
.40
.04
.47
.56
9
.83
.04
.46
.53
29
-.75
.04
.47
.48
10
-.50
.04
.51
.50
30
-.26
.04
.45
.53
11
.03
.04
.45
.54
31
-.11
.04
.65
.55
12
-.18
.04
.48
.53
32
-.23
.04
.70
.52
13
.08
.04
.42
.56
33
.00
.04
.67
.54
14
.04
.04
.59
.55
34
-.75
.04
.51
.48
15
-.44
.04
.62
.51
35
-.31
.04
.40
.52
16
.37
.04
.61
.57
36
-.25
.04
.58
.52
17
.71
.04
.56
.54
37
-.09
.04
.49
.53
18
-.73
.04
.49
.48
38
.15
.04
.57
.54
19
.47
.04
.41
.55
39
.69
.04
.54
.58
20
-.37
.04
.48
.52
40
-.39
.04
.66
.52
(b) Person-Item Reliability and Separation
Figure 1 shows the summary statistics of person measures. As seen in the figure, person reliability = .93 and standard deviation of person mean = .03. This indicates that the respondents involved in this study are highly reliable. In addition, person separation value (3.67) indicated that approximately four distinct groups can be identified in the data. In addition, the Cronbach Alpha (KR-20) of person raw score reliability = .94 indicates internal consistency.
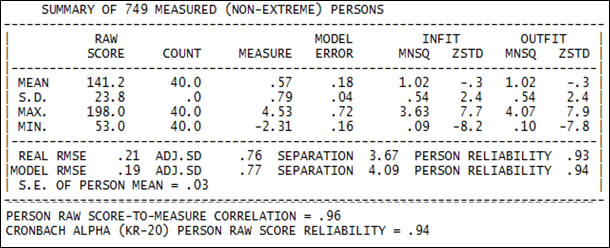
Figure 1. Summary of 749 Measured Persons
On the other hand, Figure 2 shows the summary of 40 measured items. From the figure, and item reliability = .99 and standard deviation of item mean = .07. This indicates all the 40 items in ATS measure used in this study is highly reliable and near to the perfect score of 1.00. Meanwhile, the separation value for item is 9.93 with reliability .99. This suggests that the items can be grouped into ten levels of difficulty and the items are highly reliable (near to perfect score = 1.00).
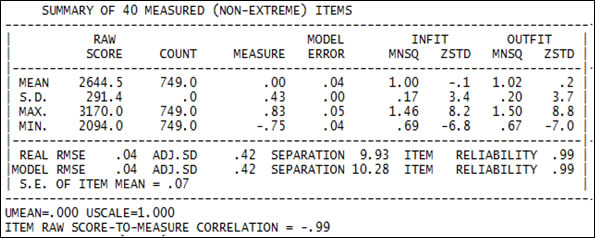
Figure 2. Summary of 40 Measured Items
Figure 3 shows the Rasch person-item map, which is representing the connection between person ability and item difficulty on the same scale.
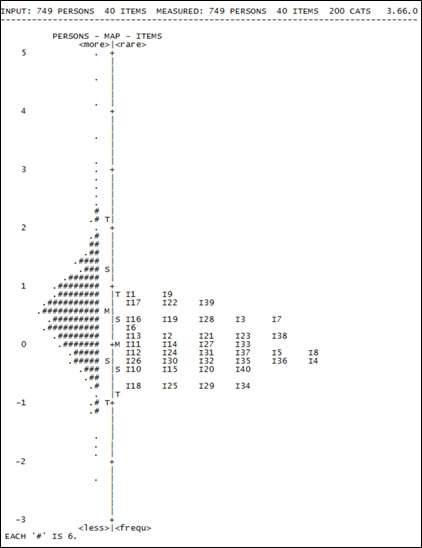
Figure 3. Person-item Map
(M = Mean; S= standard deviation away from mean; T = two standard deviations away from the mean; # = Logit position got six persons)From Figure 3, the distributions of the items and person are normally distributed, indicating that the scale is appropriate for the participants (Alquraan, Alshraideh, & Bsharah, 2008). The mean measure of item is .00 logits and for person is .57 logits. Bottom items are the items that are easily endorsed and the top items are difficult to be endorsed. The person’s ability distribution is higher than the item difficulty distribution. This suggests that on average, respondents are more likely to agree to the items. However, items cover a range of -.75 to .83 logits and persons cover a range of -2.31 to 6.46 logits. In the other words, not all items can cover the range of trait measured (Green & Frantom, 2002).
(c) Rating Scale Diagnostics
Table 10 shows output for five-category rating scale. The average measure of category 1 is -.03, meaning that the average agreeability estimate for persons answering 1 across any item is -.03 logits. Average measures function as expected as they increase monotonically across the rating scale (from -.03 to 1.66) (Lamoureux et al., 2008).
Table 10. Category Frequencies and Average Measure
*Item difficulty measure of .79 added to measures.
Category Label
Observed Count
%
Average Measure
1
62
8
-.03
2
189
25
.28
3
286
38
.49
4
179
24
1.00
5
32
4
1.66
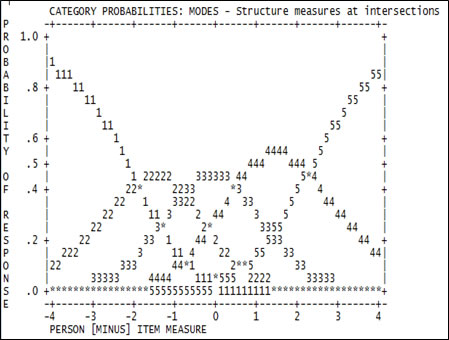
Figure 4. Probability Curve
On the other hand, Figure 4 shows the probability curve of the five-point Likert Scale used in this study. Each category has a distinct peak which represent that each category is the most probable category for some part of the continuum. In conclusion, the rating scale used in this study is suitable.
