|
Asia-Pacific Forum on Science Learning and Teaching, Volume 17, Issue 2, Article 14 (Dec., 2016) |
This section deals with activities about how enzymes are influenced by various factors. In all of the activities, catalase was used as an enzyme, and H2O2 was used as a substrate. Though H2O2 is a by-product that emerges during the normal metabolic activity of body, it damages tissues unless it is made ineffective. Catalase is an enzyme that breaks hydrogen peroxide into oxygen and water and exists in animal and plant cells.
This section presents frequency and percentage values concerning the answers given by the students in each stage in the activities entitled, “The Effect of Catalase”, “Catalase Concentration”, “Relationship between Catalase Concentration and Surface Increases in a Liver Piece”, and “Can Catalase Be Re-used?” The answers of the students regarding the reasons for their predictions and explanations are also presented.Activity 1: The Effect of Catalase (Annex 1)
Predict Stage: The students were asked to state their predictions about the gas that would come out during reaction due to catalase. All of the students correctly predicted that gas would come out as a result of reaction. 86.8% of the students stated that O2 would come out, and some of them supported their predictions by writing the reaction equation. The students making an incorrect prediction (13.2%) stated that CO2 would come out.
The students were asked to state their predictions about the change of reaction rate in the course of time. All of the students stated that reaction rate would change in the course of time; those who made correct predictions (68.42%) stated that reaction rate would firstly increase and then decrease; and those who made a partly correct prediction (23.68%) stated that reaction rate would firstly increase and then remain stable. The students who made an incorrect prediction (7.9%) said that reaction rate would increase continuously.
Table 2. Answers about Whether or Not Temperature Will Increase in the Test Tube
Student predictions
f
%
f
%
Prediction
38
Correct prediction
26
86.85
100
Partly correct prediction
9
5.26
Incorrect prediction
3
7.89
No prediction
- -
-
- -
Total
38
100
According to the Table 2, 86.85% of the students correctly predicted that temperature would increase in the test tube. The students making a partly correct prediction (5.26%) stated that enzyme activity would decrease and thus temperature would firstly increase and then decrease in the test tube. 2.63% of the students making an incorrect prediction stated that temperature would not change while 5.26% of these students stated that temperature would decrease as reaction would have to receive heat from the outside.
Observation Stage:
Table 3. Student Answers Regarding Catalase Activity Based on Observations
Student Observation Results
f
%
Foaming occurred when we added H2O2.
23
60.53
Gas bubbles came out when we added H2O2.
22
57.89
A very fast reaction took place.
9
23.68
Reaction rate was very high initially but became lower in the course of time.
15
39.47
Liver piece started to shrink during the reaction.
11
28.95
Bubbles increased in quantity and went out of the test tube in the course of time.
3
7.89
Liver started to break into pieces.
8
21.05
Liver piece changed color.
3
7.89
Liquid accumulated in the test tube.
2
5.26
According to the Table 3, some students gave more than one answer to the same question. Of the students, 60.53% stated that foaming occurred when H2O2 was added onto the liver; 57.89% stated that gas bubbles came out; and 39.47% sated that reaction was very fast in the beginning but slowed down gradually.
Table 4. Ranking Catalase Activity Rate in the Course of Time from 0 to 5 through Observation of the Bubbles Coming out During the Reaction
Time (min)
Reaction rate1
2
4
6
8
10
f
%
f
%
f
%
F
%
f
%
f
%
1 (=very slow)
33
86.84
3
7.89
-
-
-
-
12
31.58
31
81.58
2 (=slow)
3
7.89
3
7.89
-
-
6
15.79
17
44.74
5
13.16
3 (=moderate)
1
2.63
7
18.42
16
42.11
5
13.16
7
18.42
1
2.63
4 (=fast)
1
2.63
15
39.47
10
26.32
3
7.89
1
2.63
1
2.63
5 (=very fast)
-
-
10
26.32
12
31.58
24
63.16
1
2.63
-
-
Average
1.21
3.68
3.89
4.18
2
1.26
Of the students, 86.84% stated that a very slow reaction took place immediately after H2O2 was added onto the liver; 39.47% stated that a fast reaction took place in the second minute; 42.11% stated that a moderate reaction took place in the fourth minute; 63.16% stated that a very fast reaction took place in the sixth minute; 44.74% stated that a slow reaction took place in the eighth minute; and 81.58% stated that a very slow reaction took place in the tenth minute. The averages of the answers given by the students indicate that they generally thought that reaction rate increased in the course of time initially and decreased as of the 6th minute. Only 18.42% of the students stated in the worksheets that reaction continued after the 10th minute, though very slowly (Table 4).
Explain Stage:
Table 5. Student Answers Regarding Consistency between Prediction and Observation of Gas Coming out During the Reaction
Consistency between prediction and observation
f
%
Prediction and observation are consistent.
33
86.84
Prediction and observation are partly consistent.
-
-
Prediction and observation are inconsistent.
4
10.53
No answer
1
2.63
Total
38
100
Of the students whose predictions and observations were consistent, 81.58% stated that the emerging gas was O2 and tried to explain this observation by writing the equation of the reaction, but 5.26% did not make any explanation about the emerging gas. The students whose predictions and observations were inconsistent (10.53%) made the following explanation: “My prediction was CO2. However, it turned out to be O2”. 2.63% of the students did not answer this question (Table 5).
Table 6. Student Views Regarding Consistency between Prediction and Observation of the Change in Reaction Rate in the Course of Time
Consistency between prediction and observation
f
%
Prediction and observation are consistent.
30
78.95
Prediction and observation are partly consistent.
5
13.16
Prediction and observation are inconsistent.
2
5.26
No answer
1
2.63
Total
38
100
All of the students (100%) predicted that reaction rate would change in the course of time. The students whose predictions and observations were consistent (78.95%) stated that reaction rate would increase until a certain point of time, but would decrease after that. The students whose predictions and observations were partly consistent (13.16%) made the following explanation: “Rate decreased gradually. This is because; there was no substance to affect it.” The students whose predictions and observations were inconsistent (5.26%) made the following explanation: “My prediction was that reaction rate would increase continuously, but I observed that it decreased gradually”. 2.63% of the students did not write any explanation for this question (Table 6).
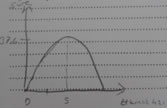
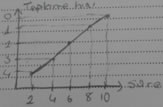
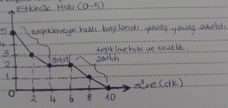
The students were asked to draw a graph showing the reaction rate of catalase in the course of time based on the data obtained from the tables they had formed through their observations. Of the students, 76.32% drew a correct graph; 13.16% drew a partly correct graph; and 7.89% drew an incorrect graph. 2.63% of the students did not draw the requested graph. Examples of these graphs are given below (Figure 2).
Correct Figure 2. The Students’ Graphs of the Reaction Rate of Catalase in the Course of Time
The averages of the answers given by the students to the questions asked in predict (88.58%), observe (61.18%), and explain (87.72%) stages were taken. In this activity, the overall success rate of the POE was found to be 79.16%.
Activity 2: Catalase Concentration (Annex 2)
Predict Stage:
Table 7. Predictions Regarding the Reactions in the Test Tubes
Test tubes and their contents
Student predictions
f
%
f
%
I.
(liver+H2O2)Prediction
38
Correct prediction
38
100
100
Partly correct prediction
-
-
Incorrect prediction
-
-
No prediction
-
-
-
-
-
Total
38
100
38
100
II.
(potato+ H2O2)Prediction
38
Correct prediction
27
71.05
100
Partly correct prediction
-
-
Incorrect prediction
11
28.95
No prediction
-
-
-
-
-
Total
38
100
38
100
III.
(chicken+ H2O2)Prediction
38
Correct prediction
31
81.58
100
Partly correct prediction
-
-
Incorrect prediction
7
18.42
No prediction
-
-
-
-
-
Total
38
100
38
100
IV.
(apple+ H2O2)Prediction
38
Correct prediction
21
55.26
100
Partly correct prediction
-
-
Incorrect prediction
17
44.74
No prediction
-
-
-
-
-
Total
38
100
38
100
For the 1st test tube, all of the students (100%) made a correct prediction and stated that reaction would take place. 23.68% of the students wrote the reaction equation while the others supported their predictions with the following explanations: “The catalase in the liver reacts with H2O2”(10);“We observed the existence of reaction in our previous experiments” (4); “The liver contains catalase (15)”.
For the 2nd test tube, 71.05% of the students made a correct prediction by stating that reaction would take place while 28.95% made an incorrect prediction by stating that reaction would not take place. While the students making correct predictions made the following explanations “There is a small amount of catalase enzyme in it” (12) and“The environment contains substrate and enzyme (4)”, 11 students did not make any explanation. Of the students making incorrect predictions, 4 did not state any reason for their predictions while 7 made the following explanations “There is no enzyme in the potato” (3); “The liver contains catalase enzyme” (1); “The potato consists of starch, that is carbohydrate” (1); “H2O2 does not affect potato enzymes” (1); “H2O2 is acid so reaction may take place” (1).
For the 3rd test tube, 81.58% of the students made a correct prediction by stating that reaction would take place while 18.42% made an incorrect prediction by stating that reaction would not take place. While 18 of the students making a correct prediction did not make any explanation, 13 made the following explanation: “The chicken contains a small amount of catalase enzyme”. Some students making an incorrect prediction made the following explanations: “The chicken does not contain any enzyme (1)”; “It contains protein” (4). On the other hand, 2 studentsid not state any reason.
For the 4th test tube, 55.26% of the students made a correct prediction by stating that reaction would take place and made the following explanation: “It contains a small amount of catalase enzyme (14)”. 7 students did not state any reason for their predictions. 44.74% of the students made an incorrect prediction by stating that reaction would not take place and made the following explanations: “The apple does not contain enzyme” (4); “The apple contains acid” (3); “The apple is composed of carbohydrate” (1). 9 students did not make any explanation.
The students were asked to predict the ranking of the test tubes in terms of reaction rate. Only 42.11% of the students were able to provide the following correct ranking: 1st Tube ˃ 3rd Tube ˃ 2nd Tube ˃ 4th Tube. In response to this question, all of the students (100%) made a correct prediction for the 1st test tube and stated that the fastest reaction would take place in this tube. 84.21% of the students correctly predicted that the reaction in the 3rd test tube would be the fastest reaction after the one involving the liver. The students making an incorrect prediction on this subject (15.79%) made the following explanations: “The chicken contains protein” (2); “Catalase is unique to the liver (4)”. 23 students (60.53%) correctly predicted that the third fastest reaction would take place in the tube involving the potato while 15 students (39.47%) made an incorrect prediction. While 11 of those students who made an incorrect prediction did not make any explanation, the others made the following explanations: “No reaction takes place as the potato contains starch” (1);“I predict that no reaction will take place in the cases of the apple and the potato because I think they do not contain enzyme” (2);“My prediction is that the apple contains more active enzymes in comparison to the potato” (1).
16 students (42.11%) correctly predicted that the slowest reaction would take place in the tube involving the apple while 22 students (57.89%) made an incorrect prediction. The students making a correct prediction made the following explanations: “Enzymes have a protein structure. Therefore, reaction takes place in all test tubes” (11); “The apple contains catalase, though in a small amount (5)”. Among the explanations made by some students making an incorrect explanations are “The apple does not react as it is acidic” (4); “The apple does not contain enzyme (11)”. 7 students did not state any reason for their incorrect predictions.
The students were asked to predict the tissues which contained more catalase. 73.68% of the students correctly predicted that the liver and the chicken contained most catalase. The explanations made by them are as follows: “The potato and the apple contain less catalase” (3); “The potato and the apple do not contain catalase” (2); “Animal tissues contain more catalase” (4); “My prediction is that they contain more catalase because they are meat” (1); “I think all the tissues we use have catalase, but I predict that animal tissues contain more catalase” (1); “Enzymes mostly affect those which have protein structure” (1); “Soft tissues contain more catalase. They break into pieces and react more easily” (1).15 students did not write any explanation for their correct predictions. 26.32% of the students made an incorrect prediction. Of these students, 9 did not state any reason while 1 student made the following explanation: “Each reaction must have a different enzyme”.
Observe Stage:
Table 8. Student Answers Regarding the Reactions Taking Place in the Test Tubes Based on Observation
Test Tube
Student Observation Results
f
%
Student Observation Results
f
%
1st Test Tube
(Liver+H2O2)
Reaction took place.
38
100
H2O came out.
1
2.63
A lot of foams emerged.
17
44.74
The color of the liver changed.
1
2.63
Gas came out.
7
18.42
A lot of bubbles emerged.
4
10.53
No explanation.
8
21.05
Reaction did not take place.
-
-
-
-
-
2nd Test tube
(Potato+H2O2)
Reaction took place.
94.74
Foaming occurred.
10
26.32
Reaction took place due to acid.
1
2.63
36
A slow reaction took place.
10
26.32
Some gas came out.
4
10.53
No explanation.
11
28.95
Reaction did not take place.
2
5.26
No explanation.
2
5.26
3rd Test tube
(Chicken+H2O2)
Reaction took place.
38
100
The second most foaming occurred.
23
60.53
Bubbles came out.
5
13.16
H2O came out.
1
2.63
No explanation.
9
23.68
Reaction did not take place.
-
-
-
-
4th Test tube
(Apple+H2O2)
Reaction took place.
33
86.84
The least foaming occurred.
7
18.42
The apple foamed little because of its acidic nature.
2
5.26
Almost no bubble came out.
6
15.79
H2O came out.
1
2.63
The slowest reaction took place in this tube.
2
5.26
No explanation.
20
52.63
Reaction did not take place.
5
13.16
No explanation.
5
13.16
For the 1st test tube, all of the students (100%) stated that reaction took place. Their explanations are as follows: “A lot of foams came out” (17); “The color of the liver changed” (1); “Gas came out” (7); “A lot of bubbles emerged” (4); “H2O came out” (1).
For the 2nd test tube, 94.74% of the students observed that reaction took place. Their explanations are as follows: “Foaming occurred” (10); “Reaction took place due to acid” (1); “A slow reaction took place” (10); “Some gas came out (4)”. 11 students who stated that reaction took place and 2 students who stated that reaction did not take place in the 2nd test tube did not make any explanation to support their views.
For the 3rd test tube, all of the students (100%) stated that reaction took place. Their explanations are as follows: “The second most foaming occurred” (23); “Bubbles came out” (5); and “H2O came out” (1).
For the 4th test tube, 86.84% of the students stated that reaction took place while 13.16% stated that reaction did not take place. Those students who stated that reaction took place made the following explanations: “The least foaming occurred” (7); “Apple foamed little because of its acidic nature” (2); “Almost no bubble came out” (6); “H2O came out” (1); and “The slowest reaction took place in this tube (2)”. 20 students stating that reaction took place in the 4th test tube did not make any explanation to support their views. None of the students who stated that reaction did not take place made an explanation to support their views.
Table 9. Ranking the Activity Rates in the Reactions in the Test Tubes in the Course of Time from 0 to 5 through Observation of the Bubbles Coming out During the Reaction
Test tubes
Reaction rate
1st test tube
(Liver+H2O2)2nd test tube
(Potato+H2O2)3rd test tube
(Chicken+H2O2)4th test tube
(Apple+H2O2)f
%
f
%
f
%
f
%
0 (=no reaction)
-
-
2
5.26
-
-
4
10.53
1 (=very slow)
-
-
8
21.05
-
-
30
78.95
2 (=slow)
-
-
4
10.53
2
5.26
1
2.63
3 (=moderate)
-
-
9
23.68
4
10.53
2
5.26
4 (=fast)
4
10.53
10
26.32
13
34.21
1
2.63
5 (=very fast)
34
89.47
5
13.16
19
50
-
-
Average
4.89
2.84
4.29
1.11
Based on the average reaction rates, the fastest reaction was seen to be in the tube containing the liver (4.89), which was followed by the one containing the chicken (4.29) and the one containing the potato (2.84) respectively. The slowest reaction took place in the tube containing the apple (1.11). There were 2 students stating that no reaction took place in the test tube containing the potato, and there were 4 students stating that no reaction took place in the test tube containing the apple.
The students were asked to express their observation results concerning what living being pieces contained more catalase among the living being pieces used in the experiment. 89.47% of the students said “liver” and “chicken” in response to this question and made the following explanations: “The most foaming occurred in the cases of the liver and the chicken” (1); “Animal tissues contain more catalase (living beings with a higher structure and much metabolic waste) (8)”. 25 of these students did not make any explanation. 5.26% of the students only said “liver” and made the following comment to justify this answer: “Only the liver contains catalase; the others do not (catalase is unique to the liver)”. 5.26% of the students did not give any answer to this question.
Explain Stage:
Table 10. Student Answers about Consistency between Prediction and Observation of the Test Tubes in which Reaction Would Take Place/Took Place
Consistency between prediction and observation
f
%
Prediction and observation are consistent.
19
50
Prediction and observation are partly consistent.
15
39.47
Prediction and observation are inconsistent.
4
10.53
No answer
-
-
Total
38
100
50% of the students stated that their predictions and observations were consistent and made the following explanations: “We had carried out the experiment with the liver and learned the reason before” (2); “Enzyme in the liver reacts with H2O2” (2); “All of them contain catalase” (4); “All the food elements we use contain enzyme (7)”. 4 of these students did not make any explanation. There was a partial consistency between the predictions and observations of 15 students (39.47%). While 10 of these students did not make any explanation, 5 made the following explanation “My prediction was that reaction would take place in the first three tubes, but it would not take place in the tube involving the apple due to its acidic nature. However, reaction took place in all of them”.
4 students (10.53%) whose predictions were inconsistent with their observations made the following explanations: “My prediction was that reaction would take place in the 1st and 3rd tubes, but it would not take place in the other tubes because they did not contain catalase. However, I observed that reaction took place in all of them and I learned that all of them contained catalase” (2); “I had predicted that reaction would take place only in the tube containing the liver as the others did not contain enzyme. However, it took place in all of them” (1); “My prediction was that catalase was only unique to the liver and did not exist in the others, and thus reaction would not take place in the others” (1).
The students were asked to predict the ranking of the test tubes in terms of reaction rate. Table 11 presents the explanations of the students concerning consistency between their predictions and their observations.
Table 11. Student Answers Regarding Consistency between Prediction and Observation of Reaction Rate
Consistency between prediction and observation
f
%
Prediction and observation are consistent.
16
42.11
Prediction and observation are partly consistent.
7
18.42
Prediction and observation are inconsistent.
15
39.47
No answer
-
-
Total
38
100
16 students (42.11%) whose predictions and observations of the ranking which was expected to be 1st Tube˃ 3rd Tube ˃ 2nd Tube ˃ 4th Tube were consistent made the following explanations: “Animal tissues contain more catalase” (5); “Our ranking is correct though we predicted its reasons incorrectly” (2); “The liver contains catalase”(9). The students whose predictions and observations of the ranking were partly consistent (18.42%) made the following explanations: “I had predicted that it would take place only in the tubes containing the liver and the chicken and I had ranked accordingly, but it took place in all of them ” (3); “I had predicted that reaction would take place in the tubes containing the potato and the chicken because the potato had starch structure and the chicken had protein structure, but I learned that the reason was different” (2); “I had predicted that the apple would involve more than the potato, but just the contrary occurred” (1); “I had predicted that it would not take place only in the case of the apple, but it took place in all of them (1)”. There was an inconsistency between the predictions and observations of 39.47% of the students. Of these students, 13 did not make any explanation while 2 made the following explanations: “I had predicted that reaction would take place only in the tube involving the liver as the others did not contain enzyme, but reaction took place in all of them” (1); “I had predicted that reaction would take place only in the test tube containing the liver as I had thought that only the liver contained catalase (1)”.
The students were asked to deliver their answers regarding consistency between their predictions and observations of which piece among the living being pieces used in the experiment contained more catalase. There was a consistency between the predictions and observations of 34 students (89.47%). “Liver” and “chicken” were given as answers. 6 students made the following explanation: “Animal tissues contain more catalase”. 28 of 34 students did not write any explanation for their answers. The students whose predictions were partly consistent with their observations (2) stated that catalase was unique to the liver and thus the liver contained most catalase. In addition, one of these students made the following explanation: “H2O2 reacted with the chicken due to its acidic nature. Its top turned white. Likewise, I think the apple and the potato reacted only due to acid as they do not contain catalase”. None of the students gave an incorrect answer to this question. 2 students left it unanswered.
The averages of the answers given by the students to the questions asked in predict (64.25%), observe (75.75%), and explain (81.58%) stages were taken. In this activity, the overall success rate of the POE was found to be 73.86%.
Activity 3: Relationship between Catalase Concentration and Surface Increases in a Liver Piece (Annex 3)
Predict Stage: This section deals with the analysis of predictions concerning the reactions in the test tubes. All of the students (100%) correctly predicted that reaction would take place in all of the three test tubes. For the 1st tube, the students made the following explanations: “Catalase involves enzyme” (16); “Some gas comes out” (2); “The slowest reaction takes place in this tube” (1); “Catalase reacts with H2O2” (7); “There is a relationship between substrate and enzyme” (6).
For the 2nd tube, the students made the following explanations: “The fastest reaction takes place in this test tube” (1); “Reaction takes place at moderate rate” (9); “Catalase involves enzyme” (14); “Surface area increased” (3); “More gas comes out from the first tube (2)”.
For the 3rd tube, the students made the following explanations: “A fast reaction takes place” (10); “Contact surface increased” (2); “Catalase involves enzyme” (13); “Surface area is the least and thus the fastest reaction takes place in this tube” (1); “Most gas comes out in this tube (2)”.
15.79% of the students for the 1st tube, 23.68% of the students for the 2nd tube, and 26.32% of the students for the 3rd tube did not write any reason for their predictions.
In regard to the tubes in which the fastest reaction and the slowest reaction would take place, all of the students (100%) correctly predicted that the slowest reaction would take place in the 1st test tube and made the following explanations: “The contacted surface area decreases” (32); “Substrate surface decreases” (5); “As the surface is large, enzyme activity decreases (1)”. 94.74% of the students correctly predicted that the fastest reaction would take place in the 3rd test tube and made the following explanations: “Substrate surface increases” (5); “Enzyme activity increases” (2); “The contacted surface area is the largest” (26); “The surface area contacted by substrate increases” (3); “Enzyme amount increases (2)”.
5.26% of the students made an incorrect prediction by stating that the fastest reaction would take place in the 2nd tube, which would be followed by the 3rd tube.
In regard to the change occurring in the contact surface as the liver is mashed, 84.21% of the students made a correct prediction and made the following explanations:“The amount of enzyme increases as surface area increases” (32); “A fast reaction takes place” (8); “Contact surface increases as liver is smashed” (2); “Enzyme activity increases” (2); “A fast reaction takes place just like the faster melting of granulated sugar in comparison to cube sugar (1)”. The students wrote more than one explanation for this question.
6 students (15.79%) who made an incorrect prediction made the following explanations: “It does not affect enzyme amount” (4); “Increase in surface area only increases reaction rate” (1); and “Enzyme amount decreases as contact surface increases” (1).
Observe Stage: In regard to the reactions in the test tubes, all of the students observed that reaction took place in all of the three test tubes.
For the 1st test tube, the students made the following explanations: “Catalase and H2O2 reacted” (12); “The liver contains catalase” (9); “A slow reaction took place” (5); “The surface area is too large (1)”.
For the 2nd test tube, the students made the following explanations: “Contact surface increased” (2); “Reaction took place at moderate rate” (6); “Catalase and H2O2 reacted” (9); “Catalase did not lose its activity”(1).
For the 3rd test tube, the students made the following explanations: “A very fast reaction took place” (6); “Surface area is the smallest” (1); “Contact surface increased a lot” (2); “Catalase and H2O2 reacted”.
In their predictions, 28.95% of the students did not write any reason for the 1st test tube, and 52.63% of the students did not write any reason for the 2nd and 3rd test tubes.
Table 12. Ranking the Activity Rates in the Reactions in the Test Tubes in the Course of Time from 0 to 5 through Observation of the Bubbles Coming out During the Reaction
Test tubes
Reaction rate
1st test tube
(regularly sliced liver)2nd test tube
(minced liver)3rd test tube
(mashed liver)f
%
f
%
f
%
0 (=reaction yok)
-
-
-
-
-
-
1 (=very slow)
-
-
-
-
-
-
2 (=slow)
38
100
-
-
-
-
3 (=moderate)
-
-
36
94.74
2
5.26
4 (=fast)
-
-
-
-
-
-
5 (=very fast)
-
-
2
5.26
36
94.74
Average
2
3.11
4.89
All of the students (100%) observed that the slowest reaction took place in the 1st test tube while 94.74% of the students observed that the fastest reaction took place in the 3rd test tube. 2 students (5.26%) observed that the fastest reaction took place in the 2nd test tube and reaction at a moderate rate took place in the 3rd test tube. The students who wrote more than one observation result for this question made the following explanations: “The amount of enzyme increased as surface area increased”(27); “Reaction rate increased” (16); “It did not affect the amount of enzyme” (4); “As contact surface increased, H2O2 affected more” (2); “Enzyme activity increased (5)”.
Explain Stage: The students were asked to deliver their answers regarding consistency between their predictions and observations of the changes occurring in the test tubes. All of the students predicted that reaction would take place in all test tubes and thus achieved one hundred percent consistency between their predictions and observations. As a reason, 50% of the students made the following explanation: “Reaction took place because each tube contained catalase”. The explanation of 26.32% of the students is as follows: “Catalase reacts with H2O2”. 9 students (23.68%) did not make any explanation for their answers.
The students were asked to state the consistency between their predictions and observations of the tubes in which the fastest reaction and the slowest reaction would take place/took place. 94.74% of the students stated that there was a consistency between their predictions and observations and made the following general explanation: “Enzyme activity and rate increase as the contacted surface area increases”.
One of the students whose predictions and observations were inconsistent made the following explanation: “My prediction was that as contact surface decreased, reaction rate would increase and so the fastest reaction would take place in the 2nd tube. However, it was the 3rd tube”. Another student made the following explanation: “I learned that contact surface is directly proportional to reaction rate”.
The students were asked to state the consistency between their predictions and observations of the change occurring in the contact surface as the liver was mashed. 97.37% of the students stated that their predictions and observations were consistent. They made more than one explanation. Their explanations are as follows: “As the liver was mashed, the amount of enzyme increased” (12); “It did not affect the amount of enzyme. It just increased reaction rate” (8); “Reaction rate increased as contact surface increased” (16); “The amount of enzyme increased as contact surface increased” (14); “The amount of enzyme increased. However, reaction rate remained the same as the amount of substrate did not change.” (2); “Enzyme activity increased (5)”. 1 student (2.63%) who stated that there was a partial consistency between his prediction and observation made the following explanation: “I had predicted that as the liver was mashed, the amount of enzyme and reaction rate would increase, but reaction rate did not change because the amount of substrate did not change”. No student answered this question incorrectly.
The averages of the answers given by the students to the questions asked in predict (93.86%), observe (98.68%), and explain (97.37%) stages were taken. In this activity, the overall success rate of the POE was found to be 96.64%.
Activity 4: Can Catalase Be Reused? (Annex 4)
Predict Stage: The students were asked to predict whether enzymes can be reused. 2.63% of the students made an incorrect prediction by stating that enzymes cannot be reused and did not make any explanation for their predictions. 97.37% of the students made a correct prediction by stating that enzymes can be reused. 37.9% of these students did not make any explanation for their predictions. Other students made the following explanations: “Enzymes can be reused as long as conditions are appropriate” (37.84%); “Enzymes can be reused as they do not change through the reaction” (16.22%); “The structure of enzyme does not change as it is used” (5.41%).
Whether or not the liquid poured into the first test tube contained catalase was asked to the students. They were asked to write their predictions together with their reasons. 71.05% of the students correctly predicted that the liquid poured into the first test tube contained catalase, but they did not state any reason for it.
The answers of the students making an incorrect prediction (28.95%) were protein, CO2, O2+H2O, only H2O, and H2O2. The students making the prediction “O2+H2O” wrote the reaction equation as a reason while the students making the prediction “H2O2” made the following explanation: “The liquid is composed of H2O2 as it reacted with the new liver put in the first test tube again”.
The students were asked to state their predictions about the reactions to take place when the liver was added onto the liquid in the first test tube again. 86.84% of the students made a correct prediction by stating that reaction would take place in the first test tube. 52.63% of these students did not make any explanation for their predictions. The explanations made by other students in regard to this question are as follows: “Enzymes can be used again and again” (18.42%); “The added liver contains a new enzyme” (15.79%).
The students making an incorrect prediction (13.16%) stated that reaction would not take place in the first test tube and stated their reasons as follows: “As H2O2 is a substrate, it cannot be used again and again” (2.63%); “The tube only contains water” (5.27%); “The substrate turned into product” (2.63%); “The structure of the substrate was destroyed” (2.63%).
The students were asked to make a prediction regarding the reactions to take place when H2O2 was added again to the liver remaining in the second test tube. 78.95% of the students stated that a reaction would take place when H2O2 was added again to the liver remaining in the second test tube. 28.95% of these students did not make explanation for their predictions. The explanations made by other students for this question are as follows; “The liver is used again and again as it functions as an enzyme” (34.21%); “A slow reaction takes place”(15.79%).
21.05% of the students made an incorrect prediction. 5.27% of these students did not make any explanation for their predictions. Other students stated the following reasons for their predictions: “The enzyme in the liver turned into product” (7.89%); “The liver lost its property” (5.26%); “The substrate and the enzyme combined and the reaction was completed” (2.63%).
Observe Stage:
Table 13. Student Answers Regarding the Changes Occurring in the 1st and 2nd Test Tubes Based on Observation
Test tube
Student Observation Results
f
%
Student Observation Results
f
%
I.
Reaction took place.
100
H2O and O2 came out.
1
2.63
Foaming occurred.
25
65.79
38
The color of the liver changed very little.
3
7.89
Gas came out.
9
23.68
Reaction did not take place.
-
-
-
-
II.
Reaction took place.
92.11
Foaming occurred little.
3
7.9
Bubbles came out.
7
18.42
35
A very slow reaction took place.
8
21.05
Many bubbles came out.
2
5.26
Gas came out.
18
39.48
Reaction did not take place.
7.89
The enzyme in the liver turned into product.
2
5.26
3
Reaction did not take place as the liver lost its enzymes and so no gas came out.
1
2.63
According to the Table 13, all of the students observed that reaction took place in the 1st test tube. For the 2nd test tube, 92.11% of the students stated that reaction took place while 7.89% stated that no reaction took place.
Explain Stage: In regard to the consistency between predictions and observations of reusability of enzymes, 97.37% of the students stated that there was a consistency between their predictions and observations and the enzymes were reused and made the following explanations: “Reaction took place in both test tubes” (5.26%); “Another reaction took place in the case of the liver used for the second time” (44.74%); and “Enzymes do not lose their activity (31.56%)”. 15.81% of the students stated that there was a consistency between their predictions and observations but made no explanation.
The predictions and observations of 2.63% of the students were inconsistent, and they made the following explanation: “I had predicted that there would be no enzyme remaining inside for the second use of the liver, but I saw that the enzymes went unchanged through the reaction and did not disappear”.
In regard to the consistency between predictions and observations of whether or not the liquid poured into the first test tube contained catalase, 76.32% of the students wrote the reaction equation and stated that their predictions and observations were consistent by saying that the enzymes could be used again.
5.26% of the students whose predictions and observations were inconsistent made the following explanation: “My prediction was that it contained only water. However, the fact that reaction took place indicates that some H2O2 had remained from the reaction taking place in the first tube”. 18.42%, however, did not make any explanation.
The students whose predictions and observations of the reactions taking place in the 1st test tube were consistent made the following explanations; “Reaction took place” (39.48%);“We saw that the enzymes were used again and again” (23.68%); “Gas came out” (5.26%); and “Test tube got heated (13.16%)”.
2.63% of the students whose predictions and observations were inconsistent made the following explanation: “I had predicted that reaction would not take place as I thought that the liquid was only composed of water. However, it took place”. 15.79% of the students, on the other hand, left this question unanswered.
78.95% of the students stated that their predictions and observations were consistent by saying that reaction took place again in the 2nd test tube and made the following explanations: “Foaming occurred” (22.56%); “Temperature rose” (11.28%); “My prediction was that a slower reaction would take place, but a fast reaction took place” (30.08%); “We observed that the enzymes were used again and again” (15.03%).
5.26% of the students wrote that they had made an incorrect prediction by stating that reaction would not take place and thus their predictions and observations were inconsistent. 15.79% of the students did not answer this question.
The averages of the answers given by the students to the questions asked in predict (83.55%), observe (88.6%), and explain (87.5%) stages were taken. In this activity, the overall success rate of the POE was found to be 86.55%.
At observe stage, some students allegedly observed some points that were indeed impossible to observe. Some mistakes of the students at observe and explain stages are indicated in Table 14 below.
Table 14. Some Mistakes Found in the Study
*The activity entitled “Can Catalase Be Reused?”
Mistakes at Observe Stage
f
%
A rise took place in temperature.
13
34.21
Temperature firstly increased and then gradually decreased in the test tube.
7
18.42
Heat came out.
9
23.68
Product came out.
5
13.16
*The liquid in the first test tube contains protein.
1
2.63
Mistakes at Explain Stage
f
%
Reaction takes place in all of the other three tubes as the substance used is acid.
3
7.89
H2O2 reacts with the potato and the apple because of their acidic nature just like it harms our skin. They do not contain catalase.
2
5.26
Meat and soft food contain more enzymes.
3
7.89
More reaction takes places in the cases of the liver and the chicken because they are meat.
1
2.63
The potato and the apple are carbohydrates.
3
7.89
The potato and the apple are vitamins.
1
2.63
The potato contains starch.
7
18.42
The apple and the potato do not contain enzyme.
1
2.63
Catalase is unique to the liver.
9
23.68
Enzymes have protein structure. The liver and the chicken are also proteins.
3
7.89
The liver and the chicken contain more catalase as they have a more intense protein structure.
10
26.32
High-structure living beingsust contain more catalase.
1
2.63
The mashed liver has the smallest surface area and thus the fastest reaction takes place in this tube.
2
5.26
The regularly sliced liver has the largest surface area.
2
5.26