 |
Asia-Pacific Forum on Science Learning and Teaching, Volume 17, Issue 1, Article 7 (Jun., 2016) |
After confirmatory factor analysis, values regarding standardized model was examined. It is represented in Figure 2.
Figure 2. The result of confirmatory factor analysis for five-factor solution D1: Dimension 1 (Learning Time), D2: Dimension 2 (Tentativeness), D3: Dimension 3 (Structure of Knowledge), D4: Dimension 4 (Source of Knowledge), D5: Dimension 5 (Learning Ability) P: Physics, B: Biology, C: Chemistry 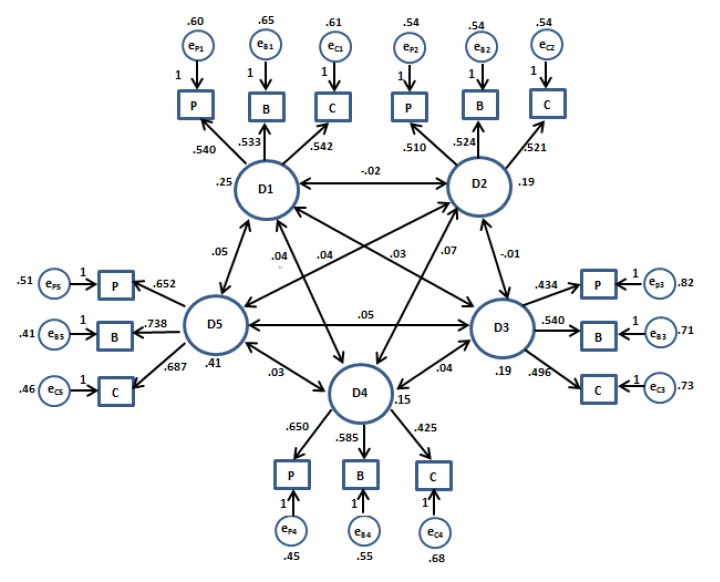
The fit values regarding the data also showed that fit indexes are in acceptable ranges. The values are represented in Table 2.
Table 2. Fit indexes for confirmatory factor analysis
Fit Indexes
CMIN/DF
GFI
CFI
RMSEA
RMR
1.10
.97
.99
.02
.03 As seen in Table 2, all of the fit indexes for the scores of the participants are in acceptable range. Chi-square ratio (CMIN/DF) index on self-efficacy scores is under 3.00 as a highest cut-off acceptable value (Arbuckle, 1997). The Comparative Fit Index (CFI) and Goodness of Fit Index (GFI) for the scores of the participants respectively are higher than .90 cut-off lower limit for CFI and .85 for GFI (Hoyle, 2000, Marsh, Balla, & McDonald, 1988). As the other indexes considered in this study, RMR is smaller than .10 as an acceptable value (Jaccard & Wan, 1996) and RMSEA is lower than cut-off .08 (Raykov & Marcoulides, 2006).
Table 3. Correlation coefficients for factors Note: All of the correlation coefficients indicated are significant at the level of .05.
Learning Time
Tentativeness
Structure of Knowledge
Source of Knowledge
Learning Ability
Total
Learning Time
-
Tentativeness
.02
-
Structure of Knowledge
.07
.01
-
Source of Knowledge
.15*
.24*
.14*
-
Learning Ability
.10
.06
.10
.11*
-
Total
.48*
.42*
.50*
.60*
.56*
- Table 3 summarized correlations between dimensions of scientific epistemological beliefs of prospective science teachers. As seen in the table, they are partially independent from each other.
Table 4. Factor loadings and Factor Score Weights of the scores on the Items Note: Factor loading refers to standardized regression weight and FSW refers to Factor Score Weights, (* ) indicates factor loading below .40. P: Physics, B: Biology, C: Chemistry.
Item Content
Items
Factors Learning Time
Tentativeness
Structure of Knowledge
Source of Knowledge
Learning Ability
Factor Loading FSW
Factor Loading FSW
Factor Loading FSW
Factor Loading FSW
Factor Loading FSW
Learning Time
P
.54
.18
.01
.01
.01
.01 B
.53
.17
.01
.01
.01
.01 C
.54
.18
.01
.01
.01
.01 Tentativeness
P
.01
.51
.16
.01
.03
.00 B
.01
.52
.16
.01
.03
.01 C
.02
.52
.18
.01
.01
.01 Structure of Knowledge
P
.01
.01
.43
.11
.01
.00 B
.01
.01
.54
.16
.02
.01 C
.02
.01
.50
.14
.02
.00 Source of Knowledge
P
.01
.02
.01
.65
.08
.00 B
.02
.04
.02
.58
.14
.00 C
.02
.05
.03
.65
.19
.01 Source of Knowledge
P
.01
.01
.01
.00
.65
.23 B
.02
.01
.02
.00
.74
.28 C
.01
.01
.01
.00
.69
.20 Cronbach Alpha Values (Total = .59)
.55
52
.48
.56
.73 In table 4, factor loadings of each dimension and Cronbach alpha reliabilities regarding to the dimensions are represented. All of the dimensions have a factor loading over .40 that is actable cut-off value for factor loadings (Li, McCoach, Swaminathan & Tang, 2008). However Cronbach alpha values are low but this situation is common (Liang et al., 2008; Koksal & Cakiroglu, 2010; Topcu & Yilmaz-Tuzun, 2008; Schommer-Aikins, Duell & Hutter, 2005). Hatcher and Stepanski (1994) stated that Cronbach alpha value as like 0.55 can be accepted for statistical processes in social studies.
Table 5. Minimum group scores, maximum group scores regarding each factor and mean of the scores for each factor.
Descriptive Statistics Regarding Minimum Group Scores, Maximum Group Score, Mean of Scores
N
Minimum Group Scores
Maximum Gourp Scores Mean
Std. Deviation
F1
364
1.00
3.00
1.85
.67
F2
364
.67
3.00
1.48
.59
F3
364
.33
3.00
1.81
.69
F4
364
.33
3.00
1.65
.65
F5
364
1.00
3.00
1.77
.76
Total
364
1.00
2.60
1.71
.35
Valid N (listwise)
364
In Table 5 scores of the participants on the inventory are represented, it can be seen that the participants had unsophisticated beliefs regarding F1 while they had mixed beliefs regarding F2, F3, F4 and F5.


Copyright (C) 2016 EdUHK APFSLT. Volume 17, Issue 1, Article 7 (Jun., 2016). All Rights Reserved.