|
Asia-Pacific Forum on Science Learning and Teaching, Volume 17, Issue 1, Article 9 (Jun., 2016) |
Data collection & analysis
Data Collection
The data for the research were collected using four tools. The first one was Chemistry Achievement Test developed by the authors, two of them were surveys (Learning Strategies Survey developed by Pintrich, et al., (1991) and Student Evaluation Questionnaire ‘SEQ’ improved by the authors) and the last one was an examination that included quantitative problems which were selected from the textbook (Brown, LeMay, & Bursten, 2000). CAT and LSS were applied to the EG and the CG before and after the implementation. SEQ only was applied to the EG after the implementation. Finally quantitative problems were performed to both groups at the end of the implementation. The details of them are explained as follows:Chemistry Achievement Test (CAT)
CAT is multiple-choice test assessing students’ knowledge of fundamental chemistry concepts (classifications of matter, properties of matter, the atomic theory of matter, the discovery of atomic structure, the modern view of atomic structure, and the periodic table) contained 25 questions. The sample questions are presented in Figure 1.Figure 1. Sample questions in the test
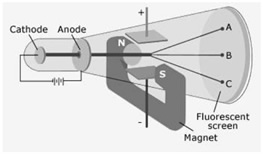
Question 1
The diagram above shows a cathode ray passing through the region between two oppositely charged parallel plates and a magnet. Which path will the cathode ray travel?
a) A
b) B
c) C
d) A-B
e) B-CQuestion 2
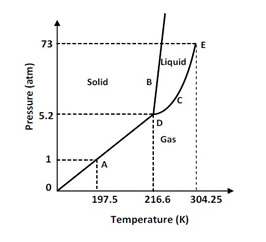
The triple phase diagram of carbon dioxide is given below. Which of the following statements is definitely incorrect?
a) It is solid at 197.5 °K and 1 atm.
b) It sublimates above 304.25 °K.
c) Triple is at 216.6 °K and 5.2 atm.
d) It is liquefied by increasing pressure at 230 °K.
e) Point E is the critical point.The validity and reliability of the CAT were tested by using classical test theory. Three professors reviewed the face and content validity. Corrections were conducted on the basis of their suggestions. The items were tested on 250 randomly selected students not involved in the present research. Corrections were made based on these students’ recommendation concerning the difficulties in answering the questions. The reliability coefficient of the pilot test was calculated as 0.82 using the Kuder-Richardson 21-formula. The reliability coefficient is acceptable for an instrument of this type (Fraenkel & Wallen, 2009).
The discrimination and difficulty indices of each multiple choice test question were analyzed. The difficulty indices of the questions ranged from 0.25 to 0.87. The difficulty index value is accepted between less than 30% (difficult) and greater than 80% (easy) (Mitra, et al., 2007). The discrimination indices (D) ranged from 0.30 to 0.81. Ebel (1972) categorized items based on classical test theory as follows. An item with a negative discrimination index must be discarded. D should be revised as poor between 0.0 and 0.19. D should be accepted as normal between 0.20 and 0.29. D should be accepted as good between 0.30 and 0.39. D should be accepted as excellent greater than 0.40. These index values were reasonably accepted without changing for further modification of the test items (Black, 1999).
Learning Strategies Survey (LSS)
Pintrich, et al. (1991) developed Motivated Strategies for Learning Questionnaire to evaluate learners’ motivations and their learning strategies. The survey comprises two sections (motivation survey with 31 items and learning strategies survey with 50 items) in the English version. The learning strategies survey was used in this research. The learning strategies survey consists of “cognitive/metacognitive strategies" (rehearsal, organization, elaboration, critical thinking, and metacognitive self-regulation) and “resource management strategies" (help seeking, peer learning, effort regulation, and time and study environment). LSS was modified and translated into Turkish by Buyukozturk, et al., (2004). The detail statistical findings of their research can be found from their research paper.Quantitative Problem Solving
Problem-solving performance of the students in the groups was evaluated with an examination having four quantitative problems. The problems were analyzed according to problem solving strategy steps which are identifying the fundamental principle (IFP), solving (SLV), and checking (CHK) (Gok, 2013, 2015). A handout on problem solving strategy steps (Gok, 2015) was delivered to the students at the beginning of the research. A sample problem from the handout is presented in Appendix A. The problems in the handout were chosen from the literature (Brown, et al., 2000).Student Evaluation Questionnaire
A questionnaire comprising 12 statements was used to evaluate peer instruction. The statements were derived from the literature (Cortright, Collins, & DiCarlo, 2005; Giuliodori, Lujan, & DiCarlo, 2006; Nicol & Boyle, 2003) and usually expressed affective ideas and cognitive ideas of the students concerning peer instruction. The students in the experimental group anonymously completed an evaluation questionnaire on a Likert type scale with 5 choices (1= strongly disagree, 2= disagree, 3= neither agree nor disagree, 4= agree, 5= strongly agree) at the end of the research. The findings were analyzed using descriptive statistics.Data Analysis
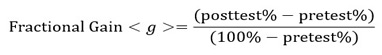
The students’ responses were analyzed using IBM SPSS Statistics 22. Descriptive statistics were calculated means and standard deviations. The fractional gains (g) of the groups developed by Hake (1998) were calculated. He recommended specific ranges based on the fractional gain formula as follows: high gain is higher than 0.7, medium gain is between 0.7 and 0.3, and low gain is lower than 0.3.ANOVA (Analysis of variance) was applied to test the implementation main effect on the posttest means of the experimental group and the control group, after identifying that the difference between the experimental group and the control group pretest means was not significant (p>0.05). Values of skewness and kurtosis were also calculated between -2 and +2. These values indicated the normal distribution (George & Mallery, 2010).