|
Asia-Pacific Forum on Science Learning and Teaching, Volume 17, Issue 1, Article 4 (Jun., 2016) |
The participants' overall viewpoints on the seven NOS (epistemology of science) issues are represented by the mean item indices (Table 3). The grand mean for all the items was modest, e.g., close to zero, and none of them were far enough from zero to meet the effect size relevance criterion (d > .30) to consider them relevantly adequate. The most positive mean item indices pertained to observations and tentativeness, and the most negative to the scientific method and the role of assumptions in science.
Overall, the sample presents insufficient or misinformed conceptions on the seven epistemological issues that were inquired into, as the grand mean indices for all issues were around zero. Within this overall poor profile, the scientific method and the role of assumptions in scientific knowledge (laws, theories, etc.) presented relatively lower negative indices, while the views on observation and the tentative nature of science scored slightly positively. The remaining epistemological issues (scientific models, classification, and epistemological status) had intermediate mean indices (scores close to zero).
Table 3. Descriptive statistics of the epistemology of science items for the whole sample (total) and for the groups of science and humanities; the last column displays the effect size of the differences between the two groups (difference expressed in mean standard deviation units).
Note: Positive effect size means the science group scores higher than the humanities group and vice-versa (Differences are usually deemed relevant if d > .30).
Science
Humanities
Total
Effect Size (d)
n
M
SD
n
M
SD
n
M
SD
F1_90211 Scientific Models
1236
-0.005
0.285
651
-0.004
0.294
1887
-0.005
0.288
-0.003
F1_90411 Tentativeness
1236
0.031
0.267
642
0.036
0.280
1878
0.033
0.271
-0.018
F1_90621 Scientific Method
1235
-0.063
0.245
648
-0.078
0.259
1883
-0.068
0.250
0.059
F2_90111 Observations
1308
0.046
0.322
577
0.078
0.313
1885
0.055
0.319
-0.101
F2_90311 Classification Schemes
1304
0.005
0.249
573
-0.008
0.260
1877
0.001
0.252
0.051
F2_90521 Role of Assumptions
1298
-0.060
0.306
573
-0.080
0.294
1871
-0.066
0.302
0.067
F2_91011 Epistemological Status
1301
-0.030
0.266
572
-0.034
0.256
1873
-0.031
0.263
0.015
The former empirical analysis could be extended to the item sentences for identifying the specific strengths and weaknesses on each question to deepen our comprehension about how a group actually understands each epistemological aspect. Due to space limitations, just an example for the group of science teachers on the three issues of Form 1 is developed. Panamanian science teachers hold informed conceptions, as they strongly support some key sentences about the change of scientific knowledge (90411C …because the interpretation or the application of the old facts can change) and scientific method (90621C… scientific method is useful in many instances, but it does not ensure results. Thus, the best scientists will also use originality and creativity). Besides, Panamanian science teachers also hold misinformed conceptions about the same issues (as they support naïve sentences) on change of scientific knowledge (90411D … because new knowledge is added on to old knowledge, the old knowledge doesn’t change) and scientific method (90621A … the scientific method ensures valid, clear, logical and accurate results. Thus, most scientists will follow the steps of the scientific method; and 90621B … the scientific method should work well for most scientists, based on what we learned in school).
Validity issues
As previously mentioned, the language and sentence wording of the items is simple and non-technical, as they arose from their original empirical development. Both forms have been previously applied to similar samples in some Latin neighbouring countries of Panama, where no problems in wording or understanding were found. Nonetheless, prior to the large application, both forms were also piloted for comprehension and cultural adequacy with small samples of Panamanian students and teachers during a science methods workshop in Panama, without any significant remarks. After the implementation to the large Panamanian sample, the rates of blank answers were also compared with those of the neighbouring countries and were found to be similar. All in all, this set of indicators supports the cross-cultural and content validity of the instruments.
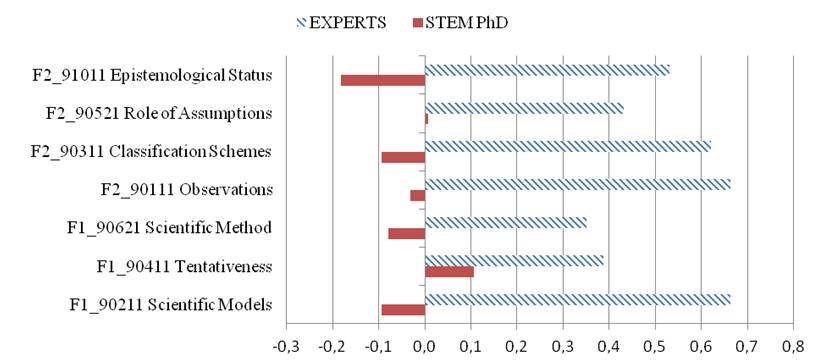
Figure 1. Average standardized indices of the seven epistemological items across the two groups compared for testing the discriminant validity of the items (a group of experts in epistemology of science and the group of Panamanian experts, with the same academic level of experts).Further, the concept or discriminant validity of the epistemological items was tested by comparing the responses of a group of eleven experts in epistemology of science against a group mined from the large Panamanian sample under the condition of being academically equivalent to the expert group. Thus, twenty-five Panamanians with a Ph.D. in science and engineering (eleven for Form 1 and fourteen for Form 2) were drawn. The average standardized indices in Figure 1 for the seven epistemological items in both groups (experts and STEM) show that the indices of the experts scored much higher than the Panamanian STEM Ph.D. group across all seven epistemological items. This result, which clearly distinguishes experts from non-experts by controlling for academic level, supports the construct and discriminant validity of the items.
The interrelatedness between diverse issues of epistemology of science is a commonplace in NOS research and a feature of its complexity. However, it has rarely been investigated due in part to the dominance of qualitative methodologies. The relationships between the epistemology items and sentences and the various conceptions are examined by means of correlation analyses that are constrained to the two independent samples (Form1 and 2).
The correlations between almost all the epistemology item indices were positive and small, though statistically significant. For instance, the Pearson coefficient between scientific method and scientific models (r = 0.253, n = 1871, p < 0.000) means that higher levels of understanding the scientific method are associated with higher levels of understanding scientific models. The same positive correlation pattern applies to the remaining pairs of items (Table 4).
However, the item on observations is the one exception to this positive pattern, as this item has insubstantial correlations with the other epistemology items. This suggests that views on observations are poorly related to the other epistemological conceptions, namely, classification schemes, the role of assumptions, and epistemological status.
Table 4. Correlation coefficients between the epistemology of science items. Coefficients of the three items of Form 1 are shown under the diagonal, and those of the four items of Form 2 are shown above the diagonal.
Note: * correlation is significant at p < .01 (bilateral).
F2_90311 classification schemes
F2_90521 role of assumptions
F2_91011 epistemological status
0.001
-0.038
0.021
F2_90111 observations
F1_90411 tentativeness
0.152*
0.247*
0.269*
F2_90311 classification schemes
F1_90621 scientific method
0.253*
0.187*
0.240*
F2_90521 role of assumptions
F1_90211 scientific models
F1_90411 tentativeness
Many of the correlations between the NOS sentence indices (not displayed here due to lack of space) were large to moderate and positive (e.g., the strongest correlation was between sentences E and F within item F1_90211 about scientific models: r = 0.618, n = 1806, p < .0000). There were also a few small and negative NOS sentence index correlations (e.g., r = -0.235, n = 1821, p < .0000 between sentences 90621B on the scientific method and 90411B on tentativeness), which means that better conceptions on sentence B of scientific method are associated with worse conceptions on sentence B of tentativeness).
Given the large number of sentence variables, correlation techniques aimed at reducing the number of these variables can help one to understand the complexity of the relationships between the single sentences about epistemology. To this end, the indices of the 16 Form-1 and 20 Form-2 sentences were studied separately through a principal component analysis (PCA), using SPSS Version 18. The prior evaluation of data suitability for PCA supported the factorability of the correlation matrix. Many correlation coefficients were greater than 0.30, the values of the Kaiser-Meyer-Olkin measure of sampling adequacy exceeded the recommended threshold of 0.6 (0.765 for Form 1 and 0.802 for Form 2), and Bartlett's sphericity test reached statistical significance (p < .000).
The PCA yielded five (Form 1) and six (Form 2) components with eigenvalues exceeding 1, explaining, respectively 14.3%, 12.3%, 11.0%, 10.9%, and 8.1% of the common variance for Form 1 and 10.4%, 9.7%, 9.3%, 9.0%, 8.5%, and 7.9% for Form 2. Inspection of the scree plot showed notable breaks after the first and third components. Using Cattell's scree test, we decided to retain three components for further investigation. The three-factor solutions for the two forms following oblimin rotation explained 43% (Form 1) and 39% (Form 2) of the common variance of the sentence indices (see table of Appendix C).
The interpretation of the factors of Form 1 suggested that each of them was mainly associated with one of the three categories used to scale the sentences according to their content. In particular, the first factor contains all the sentences categorized as naïve, the second factor groups the plausible sentences, and the third one the adequate sentences. The exceptions to this pattern are two adequate sentences that appear within the second factor, although their low loadings suggest that this assignation would require further analysis.
The interpretation of the factors of Form 2 is quite conditioned by the singular role played by item 90111 (observations), whose sentences load onto a single factor that is unique for this item, with the remaining sentences distributed between the other two factors. The second factor contains mainly the sentences categorized as naïve (except for one with a low loading), and the first factor contains mainly the plausible sentences (except for one with a low loading) and the adequate sentences.
When separate similar PCA analyses were performed for each of the four groups of the sample (young students, veteran student, pre-service teachers and teachers), the above structures were repeated across groups with only very small variations. This result suggests that the factor structures are stable in describing the participants' epistemology conceptions, regardless of the kind of respondents being considered.
Overall, the loadings of the adequate sentences in the factor structure were generally opposite in sign to those of the naïve and plausible sentences – a surprising negative correlation. This finding implies that high levels of comprehension of adequate sentences are associated with low levels of comprehension of plausible or naïve sentences, and, vice versa, that low levels of comprehension of adequate sentences are associated with high levels of comprehension of plausible or naïve sentences. The simple correlation between the plausible and naïve sentences is positive, meaning that high levels of comprehension of plausible sentences are associated with high levels of comprehension of naïve sentences.
From a logical perspective, the former is an apparently anomalous result because it indicates that the clearer a respondent's identification of the adequate sentences is, the harder he or she finds it to clarify other sentences that are just plausible or naïve. In other words, what would seem to be the logical implication of the recognition of adequate sentences, e.g., the rejection of naïve sentences or the partial recognition of plausible sentences, does not emerge from the empirical results of the principal component analysis; indeed, quite the contrary is the case. This anomalous correlation suggests some superficiality in the respondents' comprehension of NOS, in the sense that they make no use of simple logical reasoning when assessing the sentences, as a high valuation of an adequate sentence should logically imply a low valuation of the naïve sentences. A possible explanation is that the complexity involved in the comprehension of NOS leads to the respondents’ difficulties to distinguish the opposite sentences within a given item that are expressions of contrary epistemological positions and, therefore, to value them differently.
All in all, correlation analysis quantitatively contributes to shed light on the complexity of the relationships among different NOS ideas, unanimously held by the researchers, although scarcely supported by data.