|
Asia-Pacific Forum on Science
Learning and Teaching, Volume 14, Issue 2, Article 6 (Dec., 2013)
|
In the present study, 454 science projects participating in the Science Projects Event for Primary School Students were evaluated. The distribution of the projects applying to competition between 2007 and 2011 by years is given in the Table 4.
Table 4. The number of projects in sciences
Science Field
The Number of Projects
Total
2007
2008
2009
2010
2011
Comer To Regional Science Board
118
50
85
113
88
454
Invited To Bursa Regional Exhibition
48
20
41
33
39
181
Invited To Turkey Selections
5
2
3
4
4
20
The Award-Winning By Being Placed In The First Fifty In Turkey Selections
1
1
3
1
3
9
According to the table 4, 181 of 454 projects coming to the Regional Science Board were invited to Bursa Regional Exhibition. Of these projects, 20 projects were found worthy of being exhibited in Ankara for competition across Turkey. Of these projects, 9 ranked among the top 50 and received awards. The criteria were not the same during the selection of these projects. In the first elimination, the projects were mostly evaluated based on the specific criteria of teachers in provinces. The projects were subjected to a second elimination at the provincial department of review and the regional science board consisting of the representatives of each province, who were experienced teachers. A short training was provided to this board in regard to evaluation criteria. Then, a 5-person board composed of specialized faculty members put the projects into a third elimination process in the region. This board performed evaluation based on the criteria set by TUBITAK BIDEB (2012). It was seen that selection criteria came to the forefront more in this third evaluation stage. It was determined that disregard for criteria during project evaluation caused some works that were not suitable for exhibition to appear at the regional exhibition.
Distribution of the current school types by provinces is given in the table 5 (based on official data). Based on the data in the table, it is understood that public schools are 97.29%, private schools are 2.43%, and science & arts centers are 0.28%, which is very low.
Table 5. The distribution of the projects coming to MNE and TUBITAK regional science boards by provinces and school types
The Number of Public Schools
The Number of Private Schools
The Number of Science and Arts Centers
All Schools Available
The Number of Schools Coming to RSB* and TUBITAK
Provinces
MNE
f
Coming to RSB* and TUBITAK
F
Available
f
Coming to RSB* and
TUBITAKf
Available
f
Coming to RSB* and
TUBITAK f
Total
Total
Afyonkarahisar
479
(98.96%)
32
(84.21%)
4
(0.83%)
-
1
(0.21%)
6
(15.79%)
484
38
Balıkesir
555
(98.23%)
39
(90.7%)
9
(1.59%)
4
(9.30%)
1
(0.18%)
-
565
43
Bilecik
77
(96.25%)
34
(54.84%)
2
(2.50%)
16
(25.81%)
1
(1.25%)
12
(19.35%)
80
62
Bolu
85
(97.7%)
4
(100%)
2
(2.3%)
-
-
-
87
4
Bursa
584
(95.58%)
71
(58.19%)
25
(4.09%)
39
(31.97%)
2
(0.33%)
12
(9.84%)
611
122
Çanakkale
194
(98.48%)
18
(94.74%)
3
(1.52%)
1
(5.26%)
-
-
197
19
Düzce
201
(98.05%)
24
(100%)
3
(1.46%)
-
1
(0.49%)
-
205
24
Eskişehir
237
(96.73%)
19
(90.48%)
7
(2.86%)
1
(4.76%)
1
(0.41%)
1
(4.76%)
245
21
Kocaeli
340
(95.51%)
11
(68.75%)
15
(4.21%)
5
(31.25%)
1
(0.28%)
-
356
16
Kütahya
338
(97.69%)
57
(85.07%)
8
(2.31%)
7
(10.45%)
-
3
(4.48%)
346
67
Sakarya
375
(97.91%)
10
(100%)
7
(1.83%)
-
1
(0.26%)
-
383
10
Yalova
57
(93.44%)
21
(75%)
3
(4.92%)
6
(21.43%)
1
(1.64%)
1
(3.57%)
61
28
Total
3522
(97.29%)
340
(74.9%)
88
(2.43%)
79
(17.4%)
10
(0.28%)
35
(7.7%)
3620
454
*Regional Science Boards
The table 6 shows that of 454 science projects 340 (74.9%) belonged to public schools (PS), 79 (17.4%) belonged to private schools (PrS), and 35 (7.7%) belonged to science and arts centers (SAC). These ratios show that although the number of public schools was higher than other organizations, the participation was lower at these schools. On the other hand, it is seen that science and arts centers, which made up the segment of 7.7% with 35 projects, came up with projects of a higher percentage. This situation is parallel with the existence of students with special interests and skills at science and art centers. These data also show that the number of project applications is not proportional to the number of schools.
Table 6. The distribution of the projects subject to application by school types and years
Years
Total
2007
2008
2009
2010
2011
School Types
Private Schools
f
17
(3.7%)
7 (1.5%)
16
(3.5%)
19
(4.2%)
20
(4.4%)
79
(17.4%)
Public Schools
f
100 (22%)
37 (8.1%)
62 (13.7%)
78 (17.2%)
63 (13.9%)
340 (74.9%)
Science and Arts Centers
f
1
(0.2%)
6 (1.3%)
7
(1.6%)
16
(3.5%)
5
(1.1%)
35
(7.7%)
Total
f
118
(26%)
50 (11%)
85 (18.7%)
113 (24.9%)
88 (19.4%)
454 (100%)
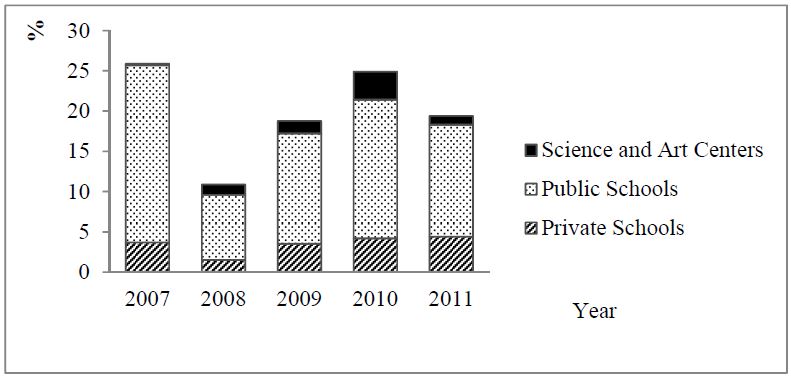
According to the table 6, the biggest number of applications was in 2007 in which 118 (26%) projects were submitted, and the fewest number of applications was in 2008 in which just 50 (11%) projects were submitted. This table also demonstrates that the biggest number of applications from PrSs was in 2011 (4.4%), from PSs was in 2007 (22%), and from SACs was in 2010 (3.5%). The numbers of project applications vary by years. Based on the numbers, it is understood that there is a disorder in applications. The 50 to 118 range is an indicator of this situation.
Figure 1. Project applications by school types and years
The Figure 1 shows that the number of applications from PSs and PrSs decreased in 2008, an increase occurred towards 2010, but another fall took place in applications from PSs in 2011. On the other hand, there was an increase in the number of project applications from SACs until 2011, but a considerable fall occurred in 2011.
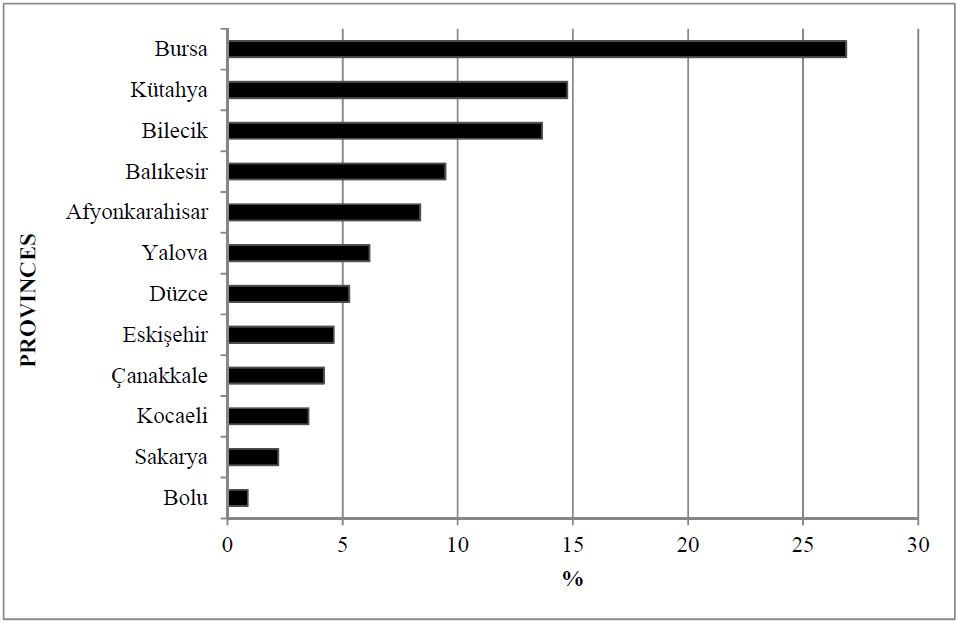
Figure 2. The distribution of project applications between 2007 and 2011 by provinces
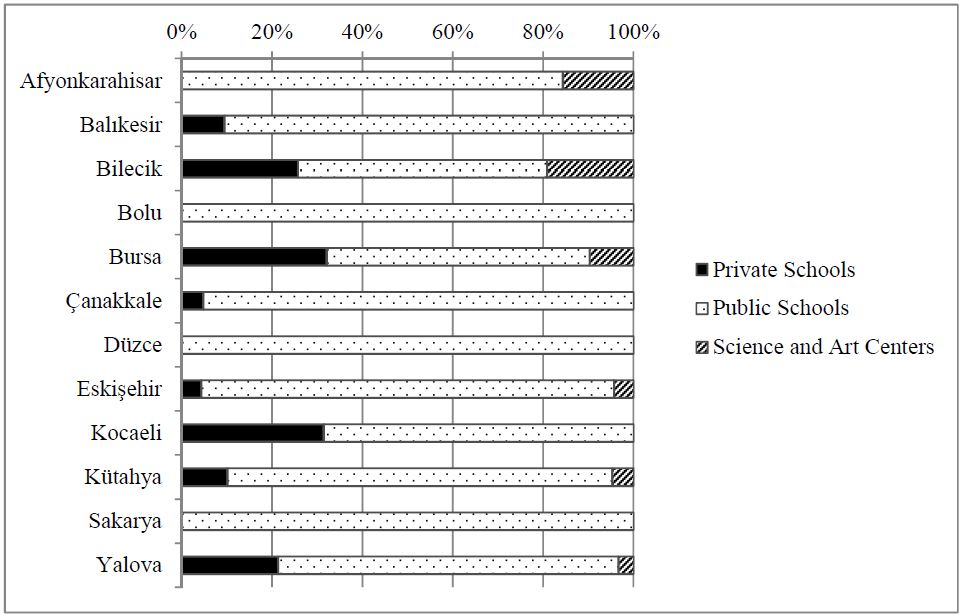
Figure 3. The distribution of project applications between 2007 and 2011 by school types
According to the figure 3, only PSs made applications from Sakarya and Düzce provinces; PSs and PrSs made applications from Kocaeli, Çanakkale, and Balıkesir; PSs and SACs made applications from Afyonkarahisar; and PSs, PrSs, and SACs made applications from Yalova, Kütahya, Eskişehir, Bursa, and Bilecik.
Table 7. The distribution of project applications between 2007 and 2011 by years, provinces, and school types
Provinces
2007 (N:118)
2008 (N:50)
2009 (N:85)
2010 (N:113)
2011 (N:88)
Total (%)
Total
PS
PrS
SAC
PS
PrS
SAC
PS
PrS
SAC
PS
PrS
SAC
PS
PrS
SAC
PS
PrS
SAC
Afyonkarahisar**
-
-
-
3
(6%)
-
1
(2%)
14
(16.5%)
-
4
(4.6%)
10
(8.8%)
-
-
5
(5.9%)
-
1
(1.1%)
32
(9.4%)
-
6
(17.1%)
38
(8.4%)
Balıkesir
6
(5%)
-
-
3
(6%)
-
-
8 (9.4%)
1
(1.2%)
-
10 (8.8%)
-
-
12
(13.6%)
3
(3.4%)
-
39
(11.5%)
4
(5.1%)
-
43 (9.5%)
Bilecik
23
(19.5%)
1
(0.8%)
-
4
(8%)
-
3
(6%)
5
(5.9%)
5
(5.8%)
1
(1.2%)
1
(0.9%)
6
(5.3%)
8
(7.1%)
1
(1.1%)
4
(4.6%)
-
34
(10%)
16
(20.3%)
12
(34.3%)
62
(13.7%)
Bolu*
4
(3.4%)
-
-
-
-
-
-
-
-
-
-
-
-
-
-
4
(1.2%)
-
-
4 (0.9%)
Bursa
16
(13.6%)
11
(9.2%)
1
(0.8%)
8
(16%)
4
(8%)
2
(4%)
9
(10.6%)
6
(7.1%)
2
(2.4%)
26
(23%)
6
(5.3%)
7
(6.2%)
12
(13.6%)
12
(13.6%)
-
71
(20.9%)
39
(49.3%)
12 (34.3%)
122 (26.8%)
Çanakkale
4
(3.4%)
-
-
2
(4%)
-
-
4
(4.6%)
-
-
2
(1.8%)
1
(0.9%)
-
6
(6.8%)
-
-
18
(5.3%)
1
(1.3%)
-
19 (4.2%)
Düzce*
24
(20.3%)
-
-
-
-
-
-
-
-
-
-
-
-
-
-
24
(7.1%)
-
-
24 (5.3%)
Eskişehir**
-
-
-
2
(4%)
-
-
7
(8.2%)
-
-
4
(3.5%)
-
-
6
(6.8%)
1
(1.1%)
1
(1.1%)
19
(5.6%)
1
(1.3%)
1
(2.9%)
21 (4.6%)
Kocaeli*
11
(9.3%)
5
(4.2%)
-
-
-
-
-
-
-
-
-
-
-
-
-
11
(3.2%)
5
(6.3%)
-
16 (3.5%)
Kütahya**
-
-
-
13
(26%)
-
-
9
(10.6%)
3
(3.5%)
-
20
(17.8%)
4
(3.5%)
1
(0.9%)
15
(17%)
-
2
(2.4%)
57
(16.8%)
7
(8.8%)
3
(8.5%)
67 (14.7%)
Sakarya*
10
(8.5%)
-
-
-
-
-
-
-
-
-
-
-
-
-
-
10
(2.8%)
-
-
10 (2.2%)
Yalova
2
(1.7%)
-
-
2
(4%)
3
(6%)
-
6
(7.1%)
1
(1.2%)
-
5
(4.4%)
2
(1.8%)
-
6
(6.8%)
-
1
(1.1%)
21
(6.2%)
6
(7.6%)
1
(2.9%)
28 (6.2%)
Total
100 (84.7%)
17 (14.4%)
1 (0.8%)
37
(74%)
7 (14%)
6
(12%)
62 (72.9%)
16 (18.8%)
7 (8.2%)
78 (69%)
19 (16.8%)
16 (14.2%)
63
(71.6%)
20 (22.7%)
5
(5.7%)
340 (100%)
79
(100%)
35
(100%)
454 (100%)
* It was removed from Bursa region in 2008.
** It attended to Bursa region after 2007.
PS: Public Schools
PrS: Private Schools
SAC: Science and Arts Centers
N: The total number of projects
Table 8. The distribution of project applications between 2007 and 2011 by years, provinces, and invitation to exhibition
Provinces
2007
2008
2009
2010
2011
Total
A
B
C
D
A
B
C
D
A
B
C
D
A
B
C
D
A
B
C
D
A
B
C
D
Afyonkarahisar
-
-
-
-
1
(5%)
3
(10%)
-
-
8
(19%)
10 (23.3%)
-
1 (33.3%)
1
(3%)
9 (11.3%)
-
-
2
(5.1%)
4
(8.2%)
-
-
12
(6.6%)
26
(9.5%)
-
1
(11.1%)
Balıkesir
3
(6.4%)
3
(4.2%)
1
(20%)
-
2 (10%)
1
(3.3%)
-
-
6 (14.3%)
3
(7%)
-
-
1
(3%)
9 (11.3%)
-
-
7 (17.9%)
8
(16.3%)
1
(25%)
1
(33.3%)
19 (10.5%)
24
(8.8%)
2
(11.8%)
1
(11.1%)
Bilecik
5
(10.6%)
19 (26.8%)
-
-
1
(5%)
6
(20%)
-
-
7 (16.7%)
4 (9.3%)
-
-
6 (18.2%)
9 (11.3%)
-
-
1
(2.6%)
4
(8.2%)
-
-
20
(11%)
42 (15.4%)
-
-
Bolu
1
(2.1%)
3
(4.2%)
-
-
-
-
-
-
-
-
-
-
-
-
-
-
-
-
-
-
1
(0.6%)
3
(1.1%)
-
-
Bursa
15
(31.9%)
13
(18.3%)
2
(40%)
1
(100%)
7 (35%)
7 (23.3%)
-
-
10 (23.8%)
7 (16.3%)
1 (50%)
1 (33.3%)
10 (30.3%)
29 (36.3%)
1 (25%)
-
11 (28.2%)
13 (26.5%)
1
(25%)
1
(33.3%)
53 (29.3%)
69 (25.3%)
5
(29.4%)
3
(33.3%)
Çanakkale
3
(6.4%)
1
(1.4%)
-
-
-
2
(6.7%)
-
-
-
4 (9.3%)
-
-
2 (6.1%)
1 (1.3%)
-
-
4 (10.3%)
2
(4.1%)
-
-
9
(5%)
10
(3.7%)
-
-
Düzce
4
(8.5%)
20
(28.2%)
-
-
-
-
-
-
-
-
-
-
-
-
-
-
-
-
-
-
4
(2.2%)
20
(7.3%)
-
-
Eskişehir
-
-
-
-
1
(5%)
1 (3.3%)
-
-
3 (7.1%)
4 (9.3%)
-
-
1
(3%)
3 (3.8%)
-
-
4 (10.3%)
4
(8.2%)
2
(50%)
1
(33.3%)
9
(5%)
12
(4.4%)
2
(11.8%)
1
(11.1%)
Kocaeli
10 (21.3%)
6
(8.5%)
1
(20%)
-
-
-
-
-
-
-
-
-
-
-
-
-
-
-
-
-
10
(5.5%)
6
(2.2%)
1
(5.9%)
-
Kütahya
-
-
-
-
5 (25%)
8 (26.7%)
-
-
4 (9.5%)
8 (18.6%)
-
-
8 (24.2%)
17 (21.3%)
3 (75%)
1 (100%)
7 (17.9%)
10 (20.4%)
-
-
24 (13.3%)
43 (15.8%)
3
(17.6%)
1
(11.1%)
Sakarya
5
(10.6%)
5
(7%)
-
-
-
-
-
-
-
-
-
-
-
-
-
-
-
-
-
-
5
(2.8%)
5
(1.8%)
-
-
Yalova
1
(2.1%)
1
(1.4%)
1
(20%)
-
3 (15%)
2
(6.7%)
2
(100%)
1 (100%)
4 (9.5%)
3
(7%)
1 (50%)
1 (33.3%)
4 (12.1%)
3 (3.8%)
-
-
3
(7.7%)
4
(8.2%)
-
-
15
(8.3%)
13
(4.8%)
4 (23.5%)
2
(22.2%)
Total
47 (100%)
71
(100%)
5 (100%)
1
(100%)
20 (100%)
30 (100%)
2
(100%)
1 (100%)
42 (100%)
43 (100%)
2 (100%)
3 (100%)
33 (100%)
80 (100%)
4 (100%)
1 (100%)
39 (100%)
49 (100%)
4
(100%)
3
(100%)
181 (100%)
273 (100%)
17 (100%)
9
(100%)
A: Invited To The Exhibition
B: Not Invited To The Exhibition
C: Invited To Turkey Selections
D: Those Be Placed in Turkey Selections
The table 7 shows the distribution of project applications by years, provinces, and school types. According to this table, PSs rank first (74.9%) in the distribution of projects by school types. They are followed by PrS projects (17.4%), and SAC projects (7.7%). Based on the distribution by provinces, it has been observed that the biggest number of applications came from the following provinces: Bursa (26.8%), Kütahya (14.7%), Bilecik (13.7%), Balıkesir (9.5%), Afyonkarahisar (8.4%), Yalova (6.2%), Düzce (5.3%), Eskişehir (4.6%), Çanakkale (4.2%), Kocaeli (3.5%), Sakarya (2.2%), and Bolu (0.9%).
Table 9. Gender distribution by years
Years
Total
2007
2008
2009
2010
2011
Gender
Females
f
99
(13.71%)
51
(7.07%)
48
(6.65%)
91
(12.6%)
85
(11.77%)
374 (51.8%)
Males
f
98
(13.58%)
32
(4.43%)
78
(10.8%)
79
(10.94%)
61
(8.45%)
348 (48.2%)
Total
f
197
(27.29%)
83 (11.5%)
126 (17.45%)
170 (23.54%)
146 (20.22%)
722
(100%)
Based on the gender distribution of the students designing projects, it has been observed that 99 females/98 males designed projects in 2007; 51 females/32 males designed projects in 2008; 48 females/78 males designed projects in 2009; 91 females/79 males designed projects in 2010; and 85 females/61 males designed projects in 2011 (Table 9).
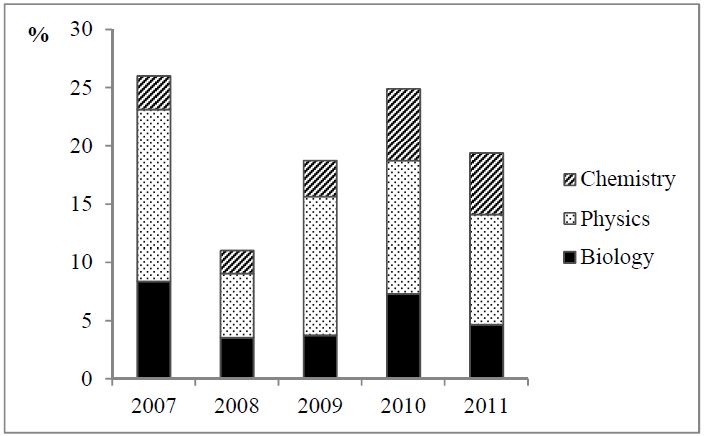
Figure 4. The subject area distribution of projects by years
Based on the subject area distribution of the project applications, it has been observed there were 241 (53.8%) projects about Physics, 125 (27.54%) projects about Biology, and 88 (19.38%) projects about Chemistry. These data show that there were more projects about Physics subjects in comparison to other subject areas (Figure 4).
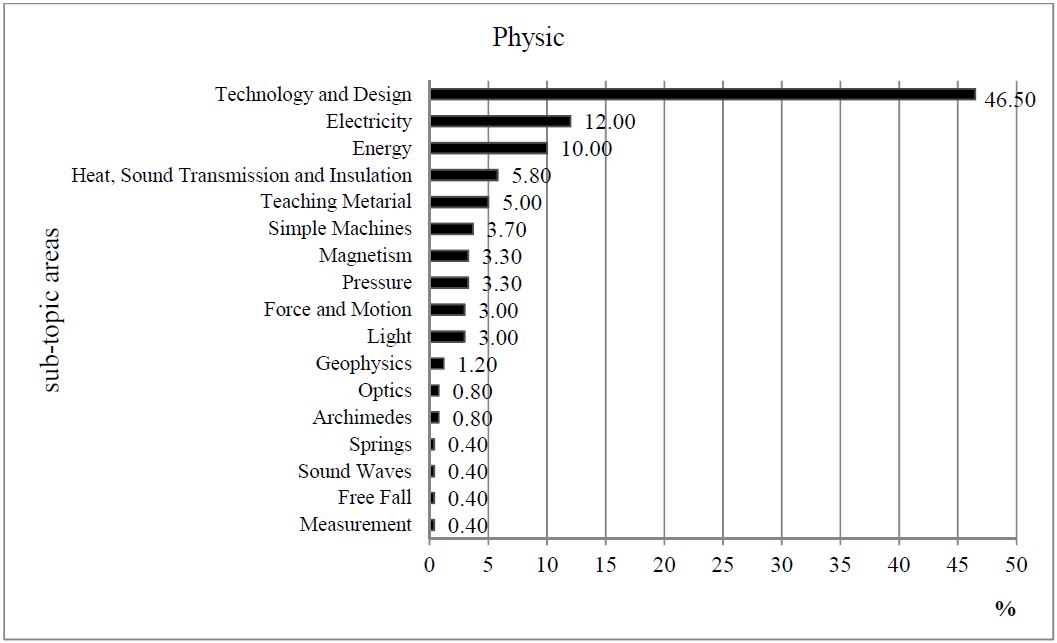
Figure 5. The distribution of physics projects by sub-subject areas
It is understood that there were more projects about Technological Design (46.5%), Electricity (12%), and Energy (10%) in comparison to other sub-subject areas (Figure 5).
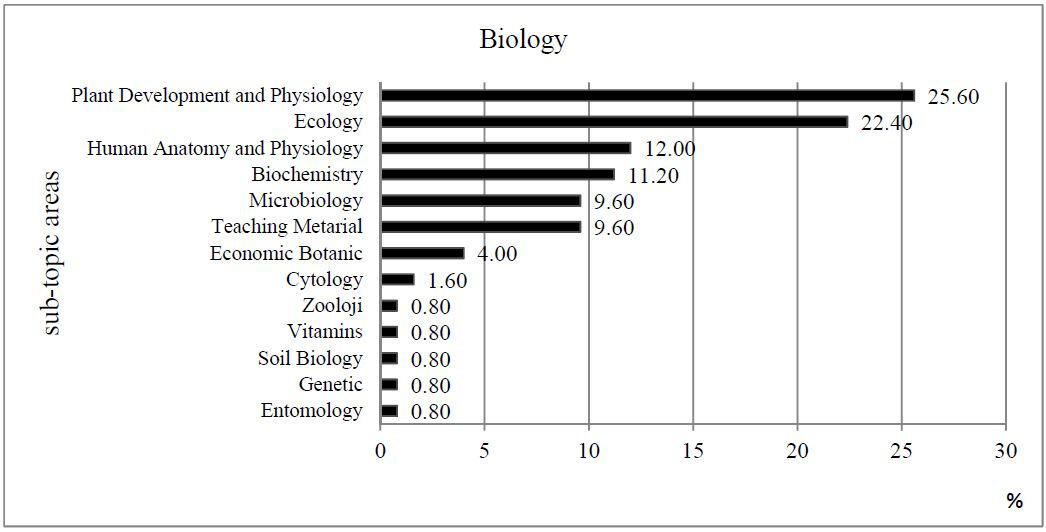
Figure 6. The distribution of biology projects by sub-subject areas
It is understood that there were more projects about Plant Development and Physiology (25.6%), Ecology (22.4%), Human Anatomy and Physiology (12%), Biochemistry (11.2%), Microbiology (9.6%), and Education Materials (9.6%) in comparison to other sub-subject areas (Figure 6).
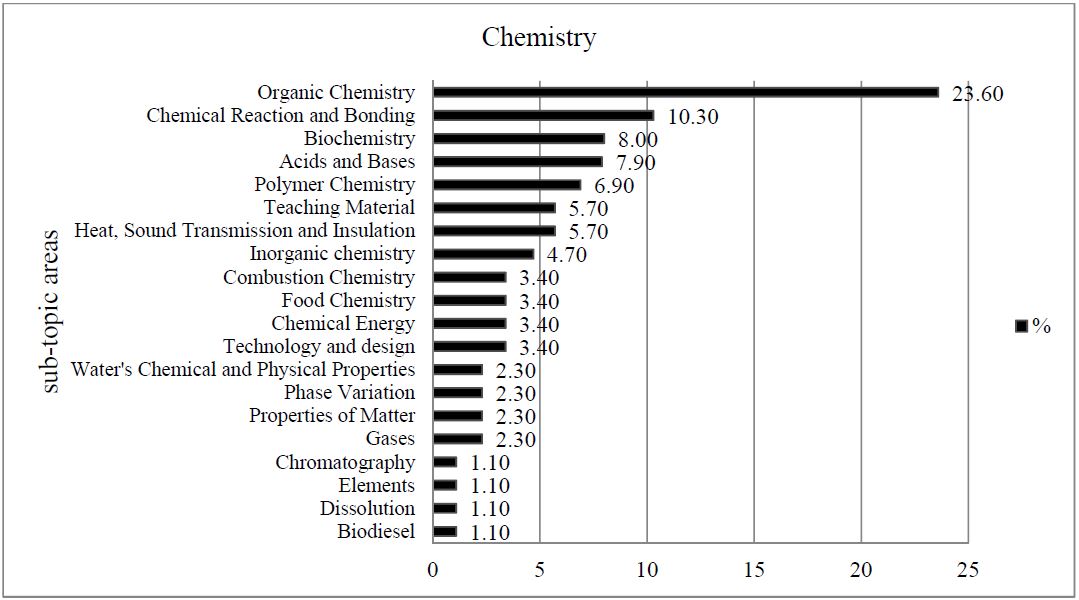
Figure 7. The distribution of chemistry projects by sub-subject areas
It is understood that there were more projects about Organic Chemistry (23.6%), Chemical Reactions and Bonds (10.3%), Biochemistry (8%), and Acids and Bases (7.9%) in comparison to other sub-subject areas (Figure 7).
The table 10 presents the findings obtained from the Evaluation Chart for Science Projects Event for Primary School Students. The results were interpreted by taking the average of two different expert evaluators.
Table 10. Evaluation chart for science projects event for primary school students
Criteria
2007-2011
YES
(%)
PARTLY
(%)
NO
(%)
TOTAL (%)
a) The Determination of Problem
1) Problem was determined.
101.5 (22.4)
248
(54.6)
104.5
(23)
100
2) Problem was clearly defined.
35
(7.7)
219.5 (48.3)
199.5
(44)
100
3) Sub-problems were determined.
1 (0.2)
8.5 (1.8)
444.5 (98)
100
b) Originality and Creativity
1) Subject is original.
23
(5.1)
167
(36.8)
264
(58.1)
100
2) A method different from the previous ones is used for
dealing with the subject.
22
(4.8)
123.5 (27.2)
308.5
(68)
100
c) Scientific Method
1) Hypothesis was established.
4 (0.9)
21.5 (4.7)
428.5 (94.4)
100
2) A plan was developed for the method to be followed.
33.5 (7.4)
214 (47.1)
206.5 (45.5)
100
3) Method contained necessary variables for testing the
hypothesis.
7.5
(1.7)
90
(19.8)
356.5
(78.5)
100
4) Experimental processes were carried out.
26.5
(5.9)
159.5 (35.1)
268
(59)
100
5) Sufficient data were collected.
8 (1.8)
93.5 (20.6)
352.5 (77.6)
100
6) Data analysis was properly performed.
13.5 (3)
93 (20.5)
347.5 (76.5)
100
d) Consistency and Contribution
1) There is a consistency between purpose and result.
42 (9.3)
332 (73.1)
80 (17.6)
100
2) There is a consistency between problem and sub-problems.
2.5 (0.6)
74.5 (16.4)
377 (83)
100
3) Provides a new approach to impart a new method or field.
2 (0.4)
49 (10.8)
403 (88.8)
100
e) Usefulness
1) It can be used for different scientific and technical fields.
5 (1.1)
86.5 (19.1)
362.5 (79.8)
100
2) An added value can be introduced to economy.
5.5 (1.2)
73 (16.1)
375.5 (82.7)
100
3) Benefits can be provided to society.
8 (1.6)
60.5 (13.5)
385.5 (84.9)
100
f) Implementability
1) It can be used to solve other problems related to the field
results have been presented.
1.5 (0.3)
83 (18.3)
369.5 (81.4)
100
g) Literature Review
1) Necessary sources were reached.
79.5 (17.5)
172 (37.9)
202.5 (44.6)
100
2) Sources were used in the Project Report.
3 (0.7)
19.5 (4.3)
431.5 (95)
100
3) Sources were associated with the project subject.
0 (0)
6 (1.3)
448 (98.7)
100
h) Result
1) The project was finalized.
361 (79.5)
69.5 (15.3)
23.5 (5.2)
100
2) Data were correctly interpreted.
12 (2.6)
199 (43.8)
243 (53.6)
100
According to the table 10, the subject and problem were clearly determined in 22.4% of 454 projects and partly determined in 54.6%. 48.3% of students provided a partial clear definition of the problem intended to be solved through project. However, 44% of students failed to provide any clear definition. It was seen that sub-problems were not determined in 98% of the projects.
It was found that 58% of the projects did not have original subjects and 68% did not have a creative nature.
It was determined that no hypothesis was established in 94.4% of the projects 47.1% of the projects had a partial plan concerning the method to be followed for reaching a solution, 45.5% did not develop any plan concerning the method to be followed for reaching a solution and 78.5% had methods not containing the variables required for testing the project hypothesis. It was concluded that 35.1% of students performed the experimental processes as required by projects, but 59% did not perform such processes. 77.6% of students failed to collect sufficient data at the end of these processes. The proper analysis of the collected data was partly conducted by 20.5% of students. 76.5% of students failed to conduct a proper analysis of the collected data.Based on the examination of consistency between purposes and solutions, it is seen that there was just a partial consistency between purpose and solution in 73.1% of the projects. 83% of the projects failed to ensure a consistency between problems and sub-problems. 88.8% of the projects did not introduce any new method to literature, and 10.8% partly achieved it.
Based on the examination of the usage of the projects in different scientific and technical fields and usefulness for the economy and society, it was observed that 79.8% of the projects did not have any feature to be used in different scientific and technical fields. 82.7% could not create any added value for the economy if they were implemented. 16.1% provide a partial added value for the economy if they are implemented, and 84.9% did not provide any benefit to society. It was seen that 81.4% of the projects put forward solutions that could be used for solving the problems about related fields.Based on the examination of the projects in terms of literature review and report writing, it is seen that 17.5% of the projects reached necessary scientific sources, 37.9% partly reached such sources, and 95% did not use such sources in the project report. 98.7% of students failed to associate the sources that were argued to be used in their projects with related project subjects.
79.5% of the projects were finalized. In 53.6% of the projects, obtained data could not be interpreted by establishing a cause and effect relationship.
Kruskal-Wallis test was carried out for determining whether there was any year-dependent significant difference between the results introduced by 8 criteria included in the Evaluation Chart for Science Projects Event for Primary School Students (Table 11). This test is a non-parametric alternative of the inter-group one way analysis of variance. This analysis allows making a comparison of three or more groups that have continuous variables.
Since significance level is lower than 0.05 in all criteria, it can be said that there is a significant difference between criteria by years (Table 11).
Table 11. The results of analysis of the criteria included in the evaluation chart for science projects event for primary school students by years
Year
N
Criteria
The Mean Ranks
2007
118
270.77
(DP)
233.15
(LR)
232.85
(SM)
191.56
(R)
179.50
(I)
172.36
(CC)
165.51
(OC)
162.51
(U)
2008
50
228.06
(SM)
222.25
(I)
191.65
(U)
183.16
(CC)
182.31
(OC)
180.39
(R)
174.18
(LR)
168.22
(DP)
2009
85
308.90
(OC)
269.92
(CC)
267.81
(I)
265.53
(U)
248.35
(R)
225.5
(DP)
174.78
(SM)
164.50
(LR)
2010
113
249.77
(U)
245.27
(R)
243.92
(OC)
240.16
(CC)
233.73
(SM)
229.94
(I)
226.86
(LR)
188.25
(DP)
2011
88
311.90
(LR)
269.68
(U)
269.40
(CC)
262.93
(SM)
259.51
(R)
255.49
(DP)
252.78
(I)
236.59
(OC)
The Table 12 shows the results of the analysis performed in order to determine whether there was any significant difference between the 8 criteria included in the Evaluation Chart for Science Projects Event for Primary School Students by school types. It was found that the scores obtained from The Determination of Problem, Originality and Creativity, Scientific Method, Consistency and Contribution, Usefulness, Implementability, Literature Review, and Result varied by school types.
Table 12. The results of the analysis of the criteria included in the evaluation chart for science projects event for primary school students by school types
Criteria
df
The Value of
Kruskal-Wallis
p
a) The determination of problem
2
2.309
0.315
b) Originality and creativity
2
3.608
0.165
c) Scientific method
2
2.720
0.257
d) Consistency and contribution
2
8.702
0.013*
e) Usefulness
2
14.092
0.001*
f) Implementability
2
7.118
0.028*
g) Literature review
2
13.556
0.001*
h) Result
2
7.118
0.028*
*p<0.05
The effectiveness of specific school types in particular criteria was determined based on mean ranks. Accordingly, it was seen that Private Schools were more successful in Literature Review and Usefulness. Public Schools were more successful in The Determination of Problem, Scientific Method and Implementability, and Science and Arts Centers were more successful in Implementability, Consistency and Contribution, and Usefulness. On the other hand, it was found that Private Schools were unsuccessful in Implementability, Public Schools were unsuccessful in Usefulness, and Science and Arts Centers were unsuccessful in Literature Review and The Determination of Problem (Table 12a).
Table 12a. The mean ranks of the criteria included in the evaluation chart for science projects event for primary school students by school types
School Types
N
Criteria
The Mean Ranks
Private Schools
79
273.65
(LR)
262.04
(U)
254.91
(R)
253.30
(CC)
248.58
(SM)
244.97
(OC)
242.20
(DP)
234.24
(I)
Public Schools
340
226.64
(DP)
222.33
(SM)
222.10
(I)
221.22
(OC)
219.18
(LR)
218.36
(R)
217.95
(CC)
215.84
(U)
Science and Arts Centers
35
264.71
(I)
262.77
(U)
262.01
(CC)
254.40
(R)
249.10
(OC)
230.14
(SM)
204.20
(LR)
202.64
(DP)
It was tested whether there was any significant difference between the criteria included in the chart by Physics, Chemistry, and Biology subject areas. The related results are given in the Table 13. Accordingly, it was determined that there was a significant difference (p˂0.05) between The Determination of Problem (p=0.006), Originality and Creativity (p=0.008), Scientific Method (p=0.036), and Literature Review (p=0.001) in physics, chemistry, and biology projects.
Table 13. The results of the analysis of the criteria included in the evaluation chart for science projects event for primary school students by subject areas
Criteria
df
The Value of
Kruskal-Wallis
p
a) The determination of problem
2
10.34
0.006*
b) Originality and creativity
2
9.74
0.008*
c) Scientific method
2
6.67
0.036*
d) Consistency and contribution
2
4.33
0.115
e) Usefulness
2
3.18
0.204
f) Implementability
2
1.91
0.386
g) Literature review
2
14.12
0.001*
h) Result
2
1.20
0.550
*p<0.05
Based on the mean orders, it is understood that a higher success was achieved in The Determination of Problem in physics projects, in Scientific Method and Literature Review in biology projects, and in Originality and Creativity in chemistry projects. On the other hand, there was a failure in Literature Review in physic projects, in Originality and Creativity in biology projects, and in The Determination of Problem in chemistry projects (Table 13a).
Table 13a. The mean ranks of the criteria included in the evaluation chart for science projects event for primary school students by subject areas
Subject Areas
N
Criteria
The Mean Ranks
Physic
241
245.8
(DP)
237.07
(OC)
231.08
(R)
230.53
(I)
228.24
(U)
225.4
(CC)
215.96
(SM)
207.8
(LR)
Biology
125
252.12
(SM)
241.6
(LR)
217.81
(I)
217.05
(R)
215.8
(CC)
214.99
(U)
209.51
(DP)
198.64
(OC)
Chemistry
88
261.41
(LR)
249.88
(CC)
243.24
(U)
242.27
(OC)
232.97
(I)
232.55
(R)
224.13
(SM)
202.93
(DP)
Based on the evaluation of the projects by status of being invited to exhibition, it is seen that there was a significant difference between those invited to the exhibition and those not invited to the exhibition in terms of all criteria (p˂0.05). In addition, it was determined that the projects invited to the exhibition were more successful in Originality and Creativity, Consistency and Contribution, Usefulness, and The Determination of Problem, but showed an intermediate success in other criteria. The projects not invited to exhibition were successful in Literature Review but were unsuccessful in other criteria.
Kruskal-Wallis test was carried out for determining whether there was any significant difference between the scores obtained through project evaluation chart by provinces. It was found that there was no significant difference between scores pertaining to the criteria apart from Scientific Method (p=0.165) by provinces (p˂0.05) (Table 14).
Table 14. The results of the analysis of the criteria included in the evaluation chart for science projects event for primary school students by provinces
Criteria
df
The Value of
Kruskal-Wallis
p
a) The determination of problem
11
26.56
0.005*
b) Originality and creativity
11
38.93
0.000*
c) Scientific method
11
15.41
0.165
d) Consistency and contribution
11
40.87
0.000*
e) Usefulness
11
44.54
0.000*
f) Implementability
11
26.65
0.005*
g) Literature review
11
43.06
0.000*
h) Result
11
26.04
0.006*
*p˂0.05
Based on the data in the table, it can be said that the projects coming from 12 provinces showed success similar to one another in terms of The Determination of Problem, Originality and Creativity, Consistency and Contribution, Usefulness, Implementability, Literature Review, and Result.
In the table 14a, the average evaluations of expert researchers were calculated in regard to the projects of 12 provinces. It was understood that the projects from Bursa, Bilecik and Çanakkale were more successful in Literature Review the projects from Düzce, Sakarya, Kocaeli and Bolu were more successful in The Determination of Problem, the projects from Kütahya were more successful in Result, the projects from Eskişehir and Afyonkarahisar were more successful in Originality and Creativity, the projects from Yalova were more successful in Consistency and Contribution, and projects from Balıkesir were more successful in Usefulness. On the other hand, the projects from Bursa and Eskişehir were unsuccessful in The Determination of Problem, the projects from Düzce were unsuccessful in Consistency and Contribution, the projects from Bilecik and Çanakkale were unsuccessful in Result, the projects from Kütahya, Afyonkarahisar and Yalova were unsuccessful in Literature Review, and projects from Sakarya, Balıkesir, Kocaeli and Bolu were unsuccessful in Originality and Creativity.
Table 14a. The mean ranks of the criteria included in the evaluation chart for science projects event for primary school students by provinces
The Mean Ranks
Provinces
N
Criteria
Afyonkarahisar
38
256.66
(OC)
256.12
(R)
245.66
(CC)
244.54
(I)
240.7
(U)
195.47
(SM)
184.26
(DP)
164.88
(LR)
Balıkesir
43
283.49
(U)
278.19
(CC)
269.79
(R)
267.84
(LR)
258.38
(DP)
250.6
(SM)
250.21
(I)
247.88
(OC)
Bilecik
62
234.31
(LR)
217.09
(I)
212.53
(DP)
212.03
(OC)
207.75
(U)
204.88
(CC)
203.18
(SM)
184.89
(R)
Bolu
4
249.63
(DP)
210.5
(CC)
190.5
(LR)
179.5
(I)
161.75
(SM)
141
(U)
116.13
(R)
114
(OC)
Bursa
122
256.07
(LR)
236.81
(SM)
231.82
(U)
229.21
(R)
227.67
(CC)
223.22
(OC)
222.73
(I)
205.04
(DP)
Çanakkale
19
269.34
(LR)
227.03
(I)
226.95
(SM)
218.76
(DP)
212.16
(OC)
198.63
(CC)
196.63
(U)
167.82
(R)
Düzce
24
261.71
(DP)
210.50
(LR)
206.85
(R)
198.65
(SM)
179.50
(I)
156.71
(OC)
149.50
(U)
129.38
(CC)
Eskişehir
21
300.5
(OC)
271.12
(U)
267.21
(I)
262.5
(SM)
253.52
(LR)
249.38
(CC)
243.55
(R)
225.07
(DP)
Kocaeli
16
313.44
(DP)
253.16
(LR)
227.03
(SM)
198.63
(R)
179.5
(I)
179.25
(U)
166.25
(CC)
161.5
(OC)
Kütahya
67
239.51
(R)
238.13
(OC)
234.66
(I)
228.69
(CC)
225.87
(DP)
217.99
(U)
215.74
(SM)
163.28
(LR)
Sakarya
10
294.2
(DP)
279.1
(SM)
241.65
(CC)
230.7
(LR)
219.35
(R)
179.5
(I)
168
(U)
148
(OC)
Yalova
28
291.16
(CC)
287.55
(U)
282.75
(OC)
276.02
(DP)
267
(SM)
263.38
(R)
259.29
(I)
220.8
(LR)