|
Asia-Pacific Forum
on Science Learning and Teaching, Volume 12, Issue 2, Article 1 (Dec., 2011) |
It was noted that 57.1% of the participants believed sharks enjoying the butchering of marine organisms (item P1 in Table 1) and the children got the lowest score (mean = 2.64, p < 0.011) in this perceptual item among the others (Table 2), indicating that it was their most negative perception towards the sharks. About 18.6% thought that the misfortune or disaster would associate with the appearance of sharks (P2). There was 37.2% believed humans were threatened by frequent shark attacks (P3), yet 26.5% realized that 'sharks are bad animals and we should kill them all' (P4). The maximum and minimum scores were 1.00 and 5.00, respectively. The mean value of the total perceptual scores was 3.26 among all participants. The mean scores were found insignificant between two genders (p = 0.778), two schools (p = 0.276) and among different age groups (p > 0.481) (Table 2).
Perceptual or conceptual items
Nature of statements
Frequency of responses in
Likert scale (%) (N = 140)
Summary (%)
5
4
3
2
1
Correct
Uncertain
Incorrect
Perceptions
P1
Sharks enjoy the butchering of marine organisms.
-ve
14.3
19.3
9.3
30.0
27.1
33.6
9.3
57.1
P2
The appearance of sharks links to the occurrence of disaster (misfortune).
-ve
34.3
27.1
20.0
12.9
5.7
61.4
20.0
18.6
P3
Human beings face a bigger threat than sharks do because of frequent shark attacks.
-ve
27.9
19.3
15.7
23.6
13.6
47.2
15.7
37.2
P4
Sharks are bad animals and we should kill them all
+ve
30.7
24.3
18.6
13.6
12.9
55.0
18.6
26.5
Mean frequency of perceptual items
26.8
22.5
15.9
20.0
14.8
49.3
15.9
34.9
Conceptions
C1
Sharks play a role of consumer in food chain.
+ve
12.1
16.4
30.7
22.1
18.6
28.5
30.7
40.7
C2
Human is the main (normal) diet type of sharks.
-ve
50.0
27.9
15.0
2.9
4.3
77.9
15.0
7.2
C3
Feeding habit of sharks can be shifted from carnivorous to herbivorous diet.
-ve
27.9
20.7
13.6
15.0
22.9
48.6
13.6
37.9
C4
Sharks play a role of predator in marine ecosystem.
+ve
25.7
31.4
15.0
15.7
12.1
57.1
15.0
27.8
C5
Number of peoples be killed by sharks is more than those be killed in traffic accidents annually.
-ve
39.3
13.6
35.0
7.1
5.0
52.9
35.0
12.1
C6
If sharks were disappeared, the marine environment would be full of life.
-ve
38.6
37.1
13.6
5.7
5.0
75.7
13.6
10.7
C7
If sharks were disappeared, the balance of marine ecosystem would not be maintained.
+ve
35.0
15.7
14.3
20.0
15.0
50.7
14.3
35.0
C8
Too many sharks living in the ocean is the main cause of decline in fish catch.
-ve
27.9
24.3
22.1
17.1
8.6
52.2
22.1
25.7
C9
If the number of sharks reduced, the amount of fish catch would dramatically rise.
-ve
28.6
30.0
20.7
13.6
7.1
58.6
20.7
20.7
C10
Many different species are living in the ocean, there won't be any effect to the whole environment if only the sharks' population were declined.
-ve
32.1
25.0
16.4
13.6
12.9
57.1
16.4
26.5
C11
As plankton is not the diet of the great white, there won't be any effect on this shark if the population of planktons were declined.
-ve
25.0
25.0
32.1
8.6
9.3
50.0
32.1
17.9
C12
If sharks were removed, other marine creatures would well proliferate leading to the enhancement of biodiversity.
-ve
35.0
24.3
17.1
15.0
8.6
59.3
17.1
23.6
Mean frequency of all conceptual items
31.4
24.3
20.5
13.0
10.8
55.7
20.5
23.8
Table 1. Percentage presentation of all participants based on the 5 points Likert Scale in different perceptual and conceptual items. For positive statements: point 5 = ‘very agree’ to point 1 = ‘very disagree’, point 3 = ‘uncertain’. For negative statements: point 5 = ‘very disagree’ to point 1 = ‘very agree’. All perceptual and conceptual items are presented in the mean frequency.
All respondents (N=140)
Gender
Age
School
Score
SD
Male
(N=55)Female
(N=85)
8
(N=13)9
(N=115)10
(N=12)School A (N=79)
School B
(N=61)Score
SD
Score
SD
Score
SD
Score
SD
Score
SD
Score
SD
Score
SD
Perceptions
P1
2.64
1.43
2.82
1.45
2.52
1.40
3.00
1.53
2.60
1.40
2.58
1.62
2.39
1.41
2.95
1.40
P2
3.71
1.22
3.75
1.24
3.69
1.23
3.85
1.46
3.73
1.17
3.42
1.51
3.92
1.21
3.44
1.20
P3
3.24
1.43
3.22
1.54
3.26
1.36
3.08
1.55
3.25
1.39
3.33
1.72
3.22
1.43
3.28
1.44
P4
3.46
1.39
3.47
1.45
3.46
1.35
4.23
1.24
3.31
1.40
4.08
1.00
3.56
1.41
3.34
1.35
Mean score
3.26
0.92
3.31
0.99
3.23
0.86
3.54
1.04
3.22
0.88
3.35
1.11
3.27
0.92
3.25
0.92
Conceptions
C1
2.81
1.26
3.02
1.30
2.68
1.23
3.15
1.28
2.80
1.29
2.58
1.00
2.99
1.39
2.59
1.04
C2
4.16
1.06
4.35
0.97
4.05
1.11
4.31
1.11
4.11
1.09
4.50
0.67
4.14
1.06
4.20
1.08
C3
3.16
1.54
2.89
1.58
3.33
1.50
4.15
1.52
3.03
1.50
3.33
1.72
3.37
1.59
2.89
1.45
C4
3.43
1.35
3.44
1.42
3.42
1.30
3.46
1.56
3.47
1.33
3.00
1.28
3.62
1.32
3.18
1.35
C5
3.75
1.19
3.76
1.23
3.74
1.18
4.08
0.95
3.74
1.21
3.50
1.31
3.82
1.26
3.66
1.11
C6
3.99
1.10
4.00
1.19
3.98
1.05
4.38
0.51
3.93
1.15
4.08
1.00
4.16
0.97
3.75
1.22
C7
3.36
1.50
3.47
1.53
3.28
1.49
3.85
1.46
3.21
1.52
4.25
0.87
3.63
1.53
3.00
1.39
C8
3.46
1.29
3.56
1.32
3.39
1.28
3.85
1.21
3.37
1.31
3.92
1.08
3.51
1.32
3.39
1.27
C9
3.59
1.23
3.42
1.21
3.71
1.24
4.08
1.04
3.53
1.24
3.67
1.37
3.59
1.28
3.59
1.19
C10
3.50
1.40
3.24
1.52
3.67
1.30
3.85
1.41
3.38
1.39
4.25
1.22
3.44
1.50
3.57
1.26
C11
3.48
1.22
3.20
1.35
3.66
1.10
3.54
1.20
3.45
1.21
3.67
1.44
3.51
1.25
3.44
1.19
C12
3.62
1.33
3.60
1.26
3.64
1.38
4.00
1.35
3.52
1.35
4.17
0.84
3.62
1.41
3.62
1.23
Mean Score
3.53
0.54
3.50
0.49
3.55
0.56
3.89
0.47
3.46
0.52
3.74
0.61
3.62
0.50
3.41
0.56
Table 2. Mean value of the perceptual and conceptual scores with standard deviation SD. The sample size is presented in parentheses.
The minimum and maximum scores of the scale range were 1.67 and 4.75, respectively. The mean score of all participants was 3.53 (N = 140, SD = 0.54). More than 51.4% of the participants achieved a score equal to or above the mean value. About 22.1% obtained a very good score of 4 or above. The level of understanding was presented in the mean scores of all participants and different demographic categories (see Table 2). Higher marks reflected the better understanding of the particular conceptual context. Three domains of the conceptual issues were focused: the feeding habit of sharks, its ecological role in the marine ecosystem and impacts on marine biodiversity.
a. Feeding habit of sharks (for items C1 – C5):
The participants got the highest proportion (77.9%) and score (mean = 4.16, p < 0.047) in C2 among all the conceptual items that realizing human not the main diet of sharks. It was noted that 95.7% (data not shown in the tables) realized fish as the main diet of sharks, yet 18.6% thought that sharks feed on seaweed. The participants got the lowest score in item C1 (mean = 2.81, p < 0.047), indicating the children did not realize the sharks playing the role of consumer in a food chain. However, 57.1% realized the sharks playing the predator role (C4) and this item got an acceptable score (3.43). It was noted that about 51.4% did not realize or falsely believed these top predators can change their feeding mode to herbivorous diet type (C3). This item score 3.16 was not significantly different from the lowest value obtained in the item C1 (p = 0.711), reflecting their understanding level to the feeding habit of the sharks should be improved. Yet girls (mean = 3.33) got significantly higher scores than the boys (mean = 2.89, p = 0.003) did in the item C3, reflecting girls may have a better cognitive understanding of the issue.
b. Ecological role (for items C6, C7, C10 and C11):
It was noted that only the item C6 (mean = 3.99) showed the higher score than that of C7 (mean = 3.36, p = 0.007). All the pairwise scores of the rest items among C6, C7, C10 and C11 showed no significant difference (p > 0.093). The results also revealed girls (mean = 3.99) got better scores than the boys did (mean = 3.20, p = 0.003) in understanding the ecological association between the planktons and the great white (C11), yet about 32.1% expressed uncertain response on the connection of these two organisms indirectly linked in the food chain.
c. Impacts on marine biodiversity (for items C8, C9 and C12):
More than 20% believed the presence of the sharks leading to the decline of fish stock and biodiversity (C8, C9 and C12). The mean conceptual scores of these items were ranged between 3.46 and 3.62 (no significant difference among the scores, p > 0.999). Yet girls (mean = 3.71) got a higher score than the boys did (mean = 3.42, p = 0.007) in the item C9.
Demographic variables do not show any obvious effect on the total mean scores of perceptual and conceptual issues in the study. But in particular conceptual items, females got a better performance than the males did yet the overall performance of the both genders was not different (p = 0.075). The conceptual score of children from two schools was not differentiated (p > 0.978), but the significant difference was revealed between the age groups of 8 (mean = 3.89) and 9 (mean = 3.46, p = 0.015). Yet the interpretation should be handled with care because the comparison was made on very unequal size of children of different age groups and of small effect size (Z = -2.258, effect size r = 0.219) and thus further evidences are required for making an affirmative conclusion. .
Correlation between the total scores and the source of information acquired and reading preference variable in study
a. Source of information acquired1. Perceptual scores:
Only both coefficients showing the significance were presented in this section. Book (the correlation coefficients were > 0.210, p < 0.013) and parental (coefficients > 0.193, p < 0.013) sources exerted a significant correlation to the perceptual scores in item P2 (Table 3), whereas TV documentary (coefficients > 0.179, p < 0.034) exerted a positive effect in item P4. The results indicated that the children getting information from the above sources were correlated to the development of their positive perception towards the sharks in particular issues. However, sources of internet forum (coefficients > -0.172, p < 0.042) and computer games (coefficients > -0.163, p < 0.050) exhibited a negative effect in item P3 (Human face a big threats because of frequent shark attacks). In general, no information source was found to be correlated to the total perceptual scores for all participants. But the TV documentary exhibited the positive correlation to the perceptual scores in girls (coefficients > 0.330, p < 0.002).
Information sources
BK
(N=77) 55.0%DO
(N=58) 41.4%FR
(N=27) 19.2%OP
(N=95) 67.9%PA
(N=75) 53.6%PG
(N=35) 25.0%TE
(N=55) 39.3%WS
(N=73) 52.1%Perceptions
P2
P
0.212*
0.126
-0.034
0.090
0.193*
0.000
0.068
0.022
S
0.210*
0.159
-0.009
0.077
0.210*
0.006
0.066
0.052
P3
P
-0.068
0.081
-0.172*
-0.119
0.088
-0.168*
-0.004
0.033
S
-0.069
0.080
-0.177*
-0.122
0.090
-0.163*
-0.002
0.028
P4
P
-0.008
0.179*
-0.007
-0.068
0.033
-0.015
0.026
0.053
S
-0.016
0.181*
-0.019
-0.082
0.037
0.001
0.023
0.051
Overall
P
0.030
0.146
-0.142
-0.086
0.124
-0.059
0.064
0.023
S
0.001
0.156
-0.159
-0.103
0.090
-0.046
0.044
0.006
Conceptions
C1
P
0.026
-0.026
0.159
0.178*
0.102
0.046
-0.032
0.222**
S
0.031
-0.043
0.154
0.163
0.090
0.031
-0.038
0.218**
C2
P
-0.117
-0.007
-0.230**
0.020
0.171*
-0.058
0.041
-0.067
S
-0.081
0.053
-0.144
0.050
0.270**
-0.005
0.118
-0.032
C4
P
-0.096
-0.052
0.060
-0.008
-0.055
0.012
-0.191*
-0.046
S
-0.084
-0.054
0.078
0.002
-0.017
0.006
-0.180*
-0.023
C5
P
-0.094
-0.055
-0.156
-0.157
-0.075
-0.045
-0.114
-0.081
S
-0.092
-0.020
-0.142
-0.168*
-0.071
-0.018
-0.122
-0.085
C6
P
0.145
0.170*
0.056
0.033
0.184*
-0.143
0.131
0.092
S
0.102
0.215*
0.038
0.019
0.179*
-0.116
0.148
0.078
C8
P
0.009
0.084
0.037
-0.064
0.175*
-0.038
0.021
0.118
S
0.018
0.101
0.043
-0.069
0.180*
-0.025
0.016
0.115
C9
P
-0.019
0.054
0.073
-0.029
0.134
-0.171*
0.052
0.067
S
-0.036
0.081
0.088
-0.004
0.148
-0.152
0.062
0.076
C10
P
0.067
0.094
0.124
-0.170*
0.057
-0.113
0.110
0.118
S
0.067
0.136
0.139
-0.191*
0.077
-0.097
0.128
0.143
C12
P
0.088
0.153
0.017
-0.116
0.221**
-0.047
0.120
0.083
S
0.079
0.149
0.022
-0.099
0.228**
-0.045
0.103
0.097
Overall
P
-0.008
0.109
-0.004
-0.096
0.195*
-0.157
0.046
0.102
S
-0.015
0.106
0.002
-0.118
0.215*
-0.158
0.053
0.081
Table 3. Correlation of the perceptual and conceptual scores to different sources of information acquisition. Pearson correlation coefficients denoted by P (upper position) and Spearman’s rank correlation coefficients denoted by S (lower position). Correlation is significant at the p values < 0.05 * or p < 0.01 **. The significant values are displayed in bold font. For the item that not showing any significant value is not included in the table. Number of children selecting the information sources are presented in parentheses (N=X) and its percentage over all participants (N = 140) is presented aside. (Abbreviations denoting the information sources: BK-books, DO-TV documentary, FR-internet forum, OP- HK Ocean Park, PA-parents, PG-computer games, TE-teachers, WS-internet websites of government or NGO.)
2. Conceptual scores:
Sources of TV documentary (coefficients > 0.170, p < 0.045) and websites of government or NGO (coefficients > 0.218, p < 0.010) exerted the positive correlation to the conceptual scores in items C6 and C1, respectively, whereas the parental source showed the positive correlations in items C2, C6, C8 and C12. This source showed the most significant effects to the conceptual performance and it was the only source that affected the total conceptual scores among all information sources in study (coefficients > 0.195, p < 0.021). But it was interesting to find that the parental source was significantly correlated to the overall conceptual performance of boys (coefficients > 0.266, p < 0.049), whereas the TV documentary source was correlated to the performance of girls (coefficients > 0.259, p < 0.017). Yet it was unexpected to note that sources of teacher (coefficients = -0.180, p < 0.033) and Ocean Park (coefficients = -0.170, p < 0.044) exerted a negative effect in items C4 and C10, respectively.
3. PCA analysis of the information sources in association with the conceptual scores:
To further explore the possible associations among different information sources on the conceptual scores, data were analyzed by employing the PCA method. The PCA illustrated the relationships among the different parameters in a spatial distribution. Results were presented on the plane of the two principal components with the first one explained 91.4% and the second one explained 3.4% (Figure 1). Two clusters were distinctively identified from the projection of the data points onto the two dimensions. Cluster I grouped the various parameters with the acquisition of the information sources while Cluster II grouped those without. It was apparent that the scores between the groups of with (cluster I) and without (cluster II) the acquisition of the information sources (for most types) were distinctively differentiated. However, sources of internet forum and computer games were dissociated from the two main clusters. Both groups for computer game lie in the middle position between the two clusters, indicating their specific effects exerting on the participants' performance.
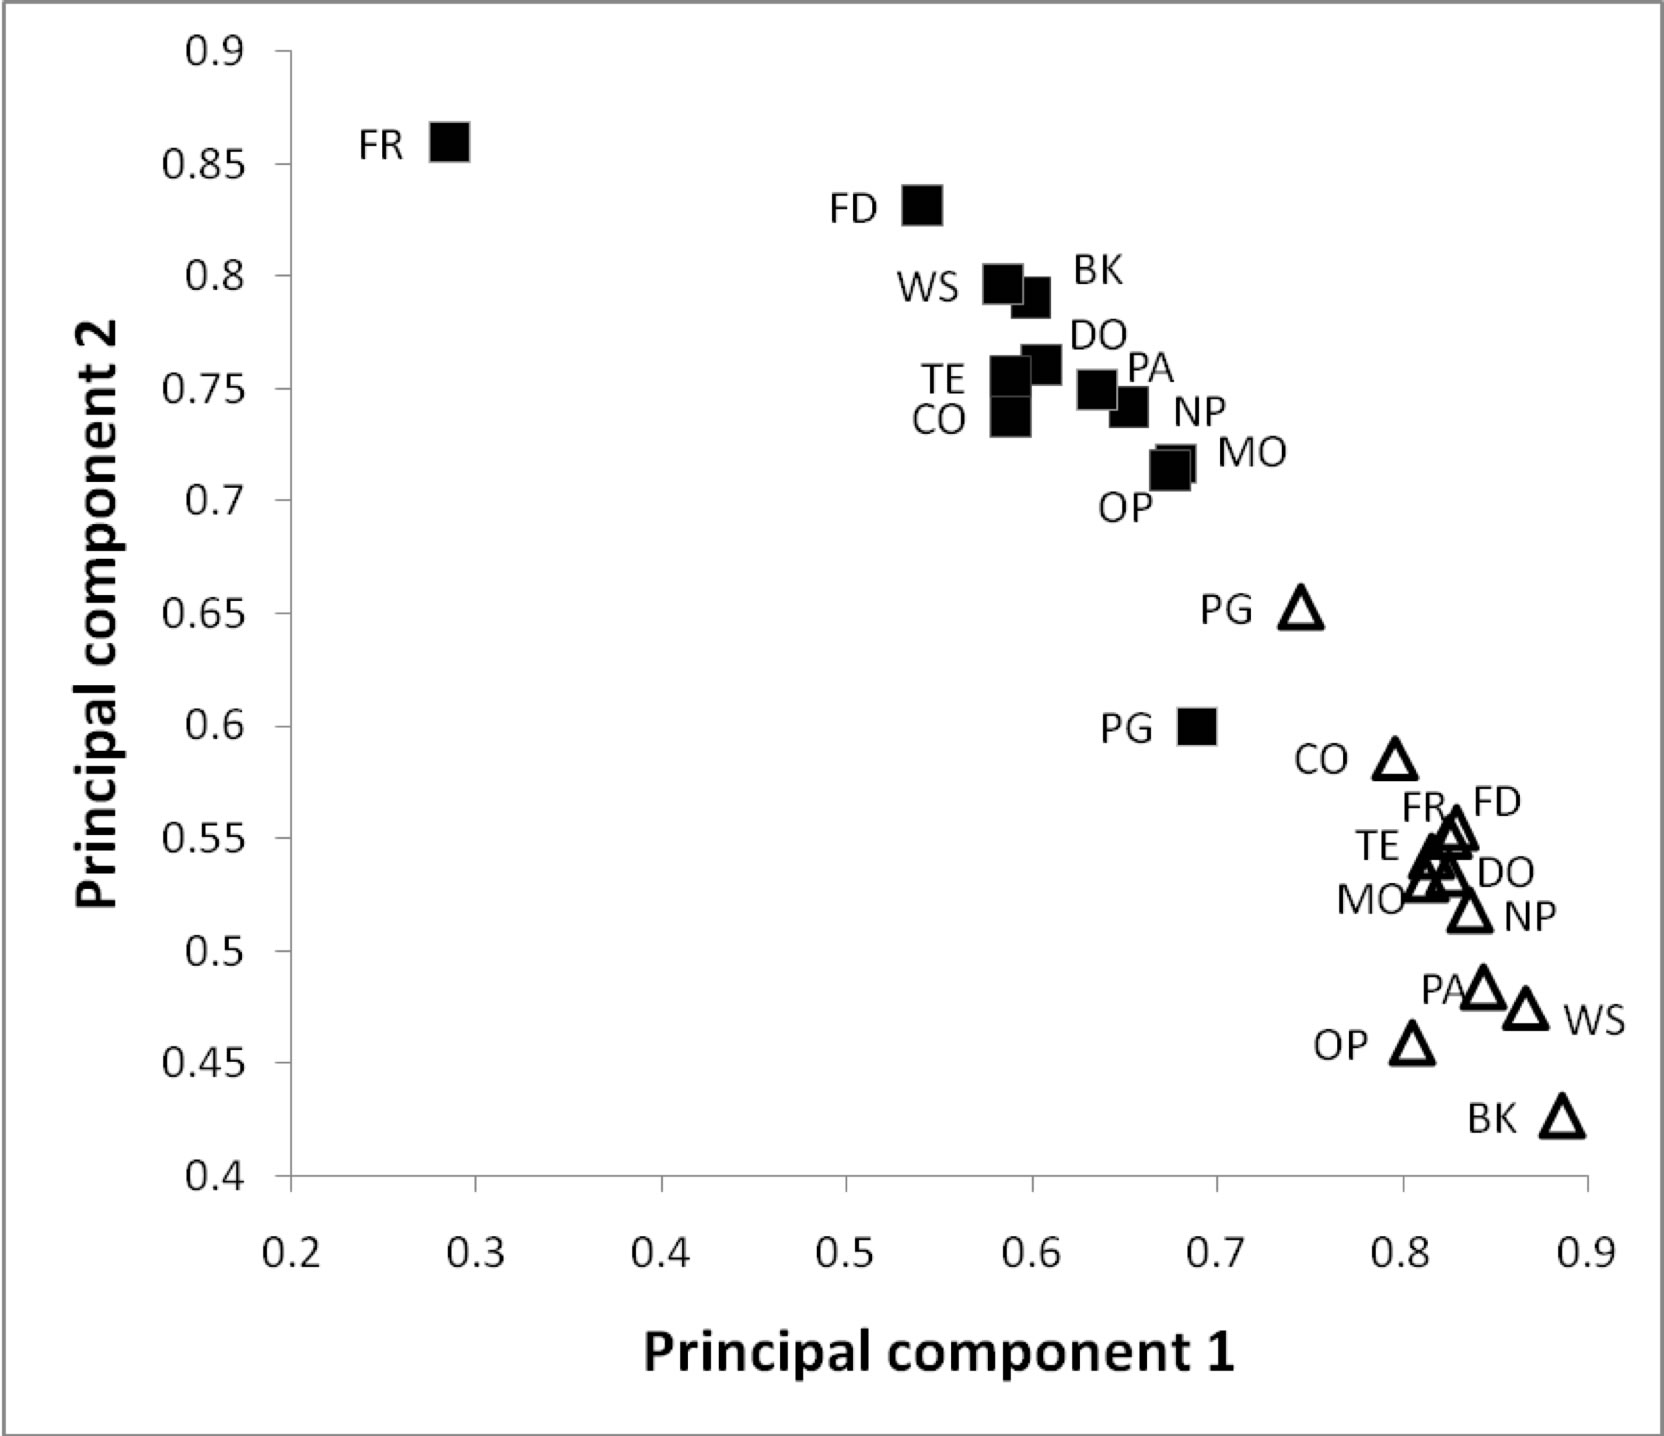
Figure 1. Ordination of acquired information sources in association with the performance on the plane of the two first axes of the PCA. The symbol
is denoted as the data score from participants showing the acquisition of the particular information source, while D is denoted as no acquisition of the source. (Abbreviations denoting the information: BK-books, CO-comics, DO-TV documentary, FD-friends, FR-internet forum, MO-movies, NP-newspapers, OP-Ocean Park, PA-parents, PG-computer games, TE-teachers, WS-internet websites (government/NGO).
b. Reading habit and preference
1. Reading habit
It was encouraging to reveal that the participants spending more time on reading would be associated with the higher total scores in perceptual (coefficients > 0.243, p < 0.005) and conceptual (Pearson correlation coefficient = 0.243, p < 0.005) issues (Table 4). It was interesting to find that the correlation was obviously significant in girls for both perceptual (coefficients > 0.236, p < 0.035) and conceptual (Pearson coefficient = 0.344, p < 0.032) scores.
Perceptual scores
Conceptual scores
Gender
All
(N=131)Gender
All
(N=131)Male (N=51)
Female (N=80)
Male (N=51)
Female (N=80)
P
0.267
0.277*
0.266**
0.050
0.344*
0.243**
S
0.293*
0.236*
0.243**
0.080
0.239
0.169
Table 4. Correlation of the perceptual and conceptual scores to the time spending on reading. Pearson correlation coefficients denoted by P (upper position) and Spearman’s rank correlation coefficients denoted by S (lower position).
Correlation is significant at the p values < 0.05 * or p < 0.01 **.2. Reading preference
i. Perceptual scores:
Participants preferring the book types of the nature were associated with the higher perceptual scores in items P2 (coefficients > 0.167, p < 0.048) and P4 (coefficients > 0.186, p < 0.028), whereas the reading preference on entertainment magazines (coefficients < -0.170, p < 0.045) and games (coefficients < -0.223, p = 0.008) exhibited a negative correlation to the perceptual scores in item P3 (human face frequent shark attacks). But in general, no reading preference was found to be correlated to the total perceptual scores (Table 5).
Reading preference
CI
(N=17) 12.1%CO
(N=75) 53.6%EN
(N=20) 14.3%GA
(N=31) 22.1%NA
(N=59) 42.1%Perceptions
P2
P
-0.110
0.017
-0.088
-0.101
0.176*
S
-0.097
0.013
-0.085
-0.104
0.167*
P3
P
-0.156
0.028
-0.170*
-0.224**
0.017
S
-0.153
0.023
-0.171*
-0.223**
0.017
P4
P
-0.014
0.116
-0.004
-0.005
0.195*
S
-0.022
0.110
0.019
0.004
0.186*
Overall
P
-0.102
0.109
-0.107
-0.122
0.149
S
-0.091
0.126
-0.098
-0.102
0.145
Conceptions
C1
P
-0.049
0.022
0.190*
0.051
-0.035
S
-0.047
0.019
0.185*
0.051
-0.036
C2
P
-0.120
0.158
0.072
-0.018
0.141
S
-0.043
0.185*
0.086
-0.015
0.159
C5
P
-0.161
0.190*
-0.051
-0.004
0.009
S
-0.168*
0.183*
-0.043
0.014
0.014
C8
P
-0.098
-0.048
-0.034
0.064
0.157*
S
-0.094
-0.066
-0.045
0.061
0.159*
C9
P
-0.090
-0.203*
-0.114
-0.089
0.106
S
-0.079
-0.206*
-0.101
-0.095
0.091
C12
P
-0.042
-0.017
-0.037
-0.068
0.168*
S
-0.048
-0.019
-0.041
-0.093
0.147
Overall
P
-0.124
0.011
0.035
-0.066
0.183*
S
-0.120
0.011
0.064
-0.053
0.164
Table 5. Correlation of the perceptual and conceptual scores to reading preference. Pearson correlation coefficients denoted by P (upper position) and Spearman’s rank correlation coefficients denoted by S (lower position). Correlation is significant at the p values < 0.05 * or p < 0.01 **. The significant values are displayed in bold fonts. For the item that not showing any significant value is not included in the table. Number of children selecting the preferred reading book type is presented in parentheses and its percentage over all participants is displayed aside. (Abbreviations denoting the information sources: CI-computer information, CO-comics, EN-entertainment magazines, GA-computer games, NA-nature)
ii. Conceptual scores:
It is interesting to note that the participants preferring the book types of comics, entertainment magazine and the nature were associated with the higher conceptual scores in items C5 (coefficients > 0.183, p < 0.030), C1 (coefficients > 0.185, p < 0.028) and C8 (coefficients > 0.157, p < 0.049), respectively, whereas the book type of comics also displayed a negative correlation to the conceptual scores of item C9 (coefficients < -0.203, p < 0.016). In general, the reading preference of the nature type was found to be positively correlated to the overall conceptual scores in Pearson correlation only (coefficient = 0.183, p = 0.031; Spearman's Rank = 0.164, p = 0.053).
c. Academic results
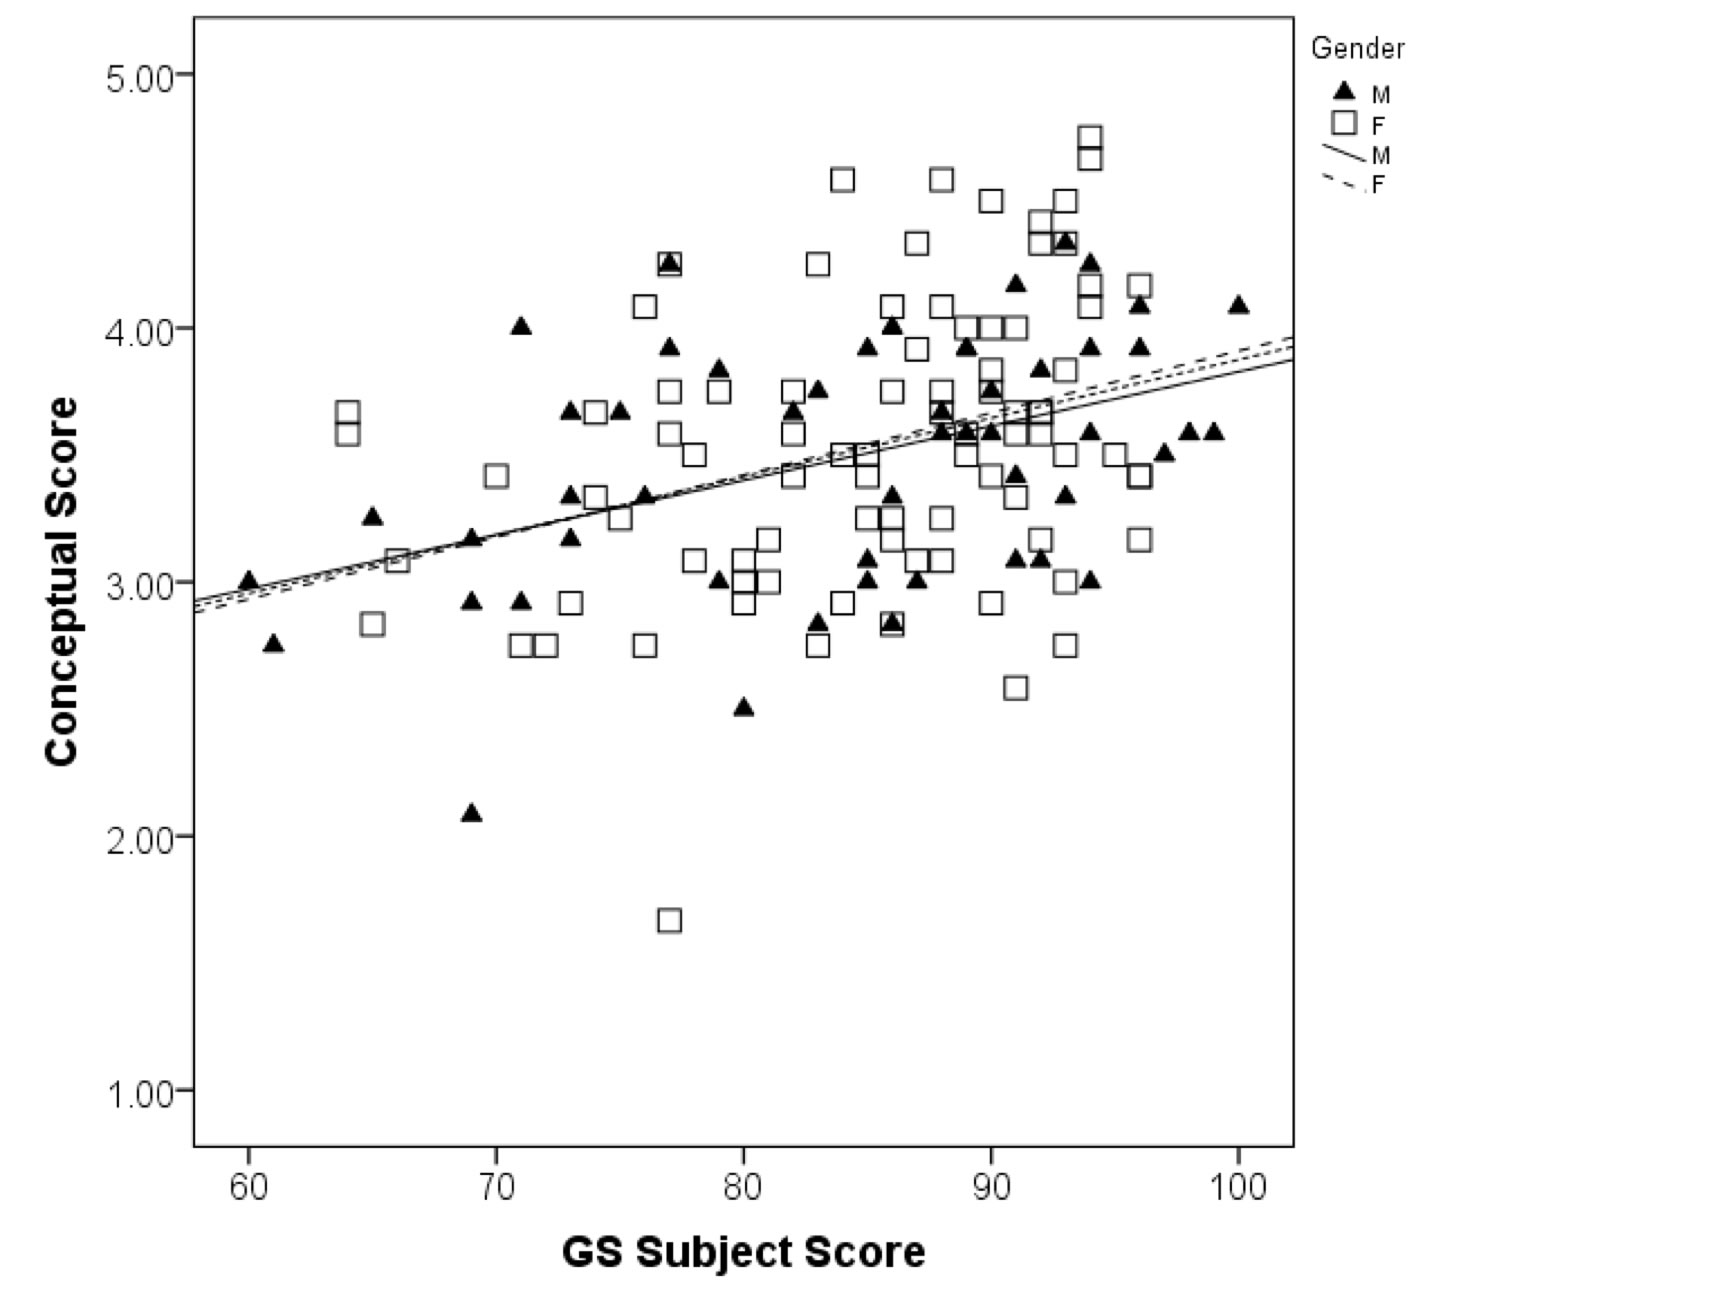
There was a significant correlation between the total conceptual scores and the final subject scores (examination results) of General Studies in the first semester of the academic year 2010-11 of all participants and different genders (p < 0.002) (Figure 2). The slopes of the regression lines for both genders were not significantly different from each other (p = 0.985), indicating no gender showed any advantage to the mean scores in relation of their academic results.
Figure 2. Relationship between the conceptual scores and the final scores of the participants in the subject General Studies in the first semester of the academic year 2010-11. Full mark of the subject score is 100. The regression equations of the best-fit lines are Y = 0.02X + 1.69 (r2 = 0.195, p = 0.002, N = 53 for male), Y = 0.02X + 1.47 (r2 = 0.121, p =0.020, N = 85 for female) and Y = 0.02X + 1.57 (r2 = 0.145, p < 0.001, N = 138 for all participants).
d. Correlation between the perceptual and conceptual scores
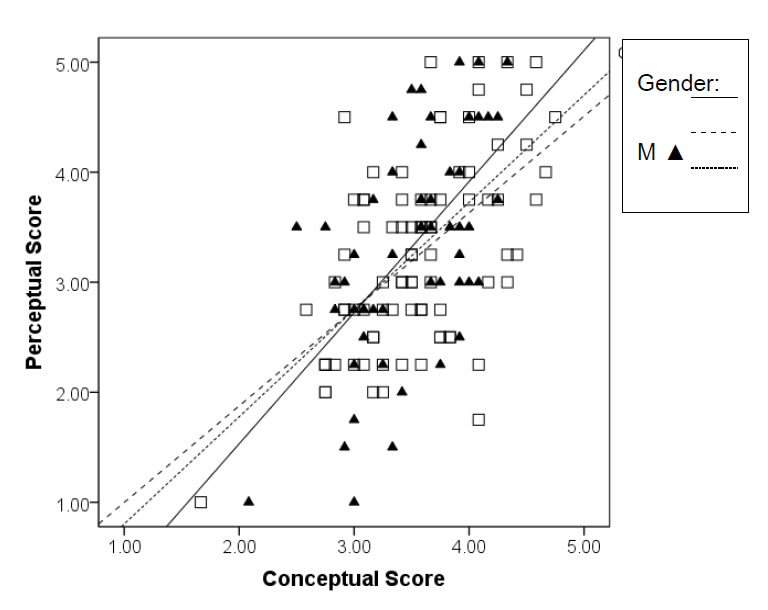
Positive and significant correlation (slope = 0.98, p < 0.001) was found between the total conceptual and perceptual scores (Figure 3), indicating that the higher level of conceptual understanding was associated with the more positive perception towards the sharks. The slopes of the regression lines for both genders were not significantly different (p = 0.223).
Figure 3. Relationship between the perceptual and conceptual scores. The regression equations of the best-fit lines are Y = 1.19X – 0.85 (r2 = 0.344, p < 0.001, N = 53 for male), Y = 0.89X + 0.12 (r2 = 0.329, p < 0.001, N = 85 for female) and Y = 0.98X – 0.17 (r2 = 0.325, p < 0.001, N = 138 for all participants).