|
Asia-Pacific Forum on Science Learning and Teaching, Volume 19, Issue 1, Article 8 (Jun., 2018) |
Hypothesis 1: There are misconceptions of students in science
Table 1.0 Analysis of Misconception Test
INo Items
Options and % of Responds
1
Photosynthesis takes place in (a)Thaylakoid **
2 (40%)(b)Grana *
(0%)(c) Photosystem I & II **
2(40%)(d)photons**
1(20%)2
Dark reaction in photosynthesis is limited by (a)Co2 , temperature and light **
1(20%)(a)Co2 light and water *
2(40%)©Water, temperature and Co2 **
1(20%)(d)Oxygen, water and temperature **
1(20%)3
Colours of light most useful in photosynthesis are (a)Green, yellow and orange **
3(60%)(b)Red, violet and blue **
1(20%)©Infra-red, red and yellow *
1(20%)(d)Red, white and blue **
0(0%)4
During what stage of photosynthesis is oxygen produced (a)Cyclic photophosphorylation **
1(20%)(b)Carbon fixation **
3(60%)(c)Kreb’s cycle **
1(20%)(d)Photosystem (i) and (ii) *
0(0%)5
Photosynthesis pigment found in (a)Cytoplasm **
2(40%)(b)Thylakoid * 0(0%) ©Stroma **
2(40%)(d)All the above **
1(20%)6
Which of the reactions produce oxygen gas (a)Respiration **
2(40%)(b)Fermentation **
1(20%)(c) Photosynthesis *
1(20%)(d) All the above **
1(20%)7
Glucose is stored in the plant as (a)Chlorophyll **
1(20%)(b) Leaves **
0(0%)(c) Sugar **
2(40%)(d) Starch *
2(40%)8
____absorbs light energy for photosynthesis (a)Vacuoles **
0(0%)(b) Nucleus **
0(0%)(c)Cytoplasm **
3(60%)(d) Chlorophyll *
2(40%)9
Solar energy converts into chemical energy by ____ (a)Respiration **
2(40%)(b)Growth **
0(0%)(c) Photosynthesis *
2(40%)(d)All the above **
1(20%)10
In order of a plant to complete photosynthesis, all must be present except gas (a)Oxygen *
1(20%)(b)Sunlight **
2(40%)Water **
1(20%)(d) Co2 **
1(20%)11
What is produce by photosynthesis (a)Glucose **
0(0%)(b)Glucose and oxygen *
2(40%)(c)Glucose & Co2 **
2(40%)(d)Glucose and water **
1(20%)12
Photosynthesis removes (a)Sunlight from earth **
0(0%)(b)Oxygen from atmosphere **
1(20%)(c)Pollution from atmosphere **
1(20%)(d)Co2 from atmosphere *
3(60%)13
Photosynthetic cells are (a)Parenchyma *
0(0%)(b)Phloem **
1(20%)(c)Collenchyma **
2(40%)(d)All the above **
2(40%)14
Photosynthesis is more in (a)C2 plant**
1(20%)(b)C3 plants *
0(0%)(c)C4 plants**
1(20%)(d)None of the above**
3(60%)15
Photosynthesis is a (a)Biological process**
1(20%)(b)Organic process**
1(20%)(c)Chemical process*
2(40%)(d)All the above**
1(20%)*Correct Answer ** Wrong respond / MisconceptionsTable 1.0 reveals that 40% of students responded the item wrong. This was item no.1 (i.e. photosynthesis takes place in a--------) with correct response was grana, but that was wrongly responded by the students. Similarly, item no. 2 (i.e. Dark reaction in photosynthesis is limited by------------) correctly responded by 40% and 60% of students wrongly responded. Item no. 3 is related with the colours of light which is mst useful in photosynthesis, responded wrongly by 80% student, only 20% of student responded correctly (i.e. Infra-red and yellow). 100% of students wrongly responded Item no. 4, (i.e. during what stage of photosynthesis is oxygen produced). It was resulted that the misconception level was growing and growing because of misconception started in preliminary level (That is item no. 1). ‘Photosynthesis pigment found in thylakoid’ that was wrongly responded by 100% of students (i.e. Item no. 5). Similarly, in item no. 6 (i.e. which reaction produces oxygen gas). The right response was photosynthesis, which was correctly responded by 20% of students. With response to item no. 7, 40% students responded (sugar) and 40% students’ responded (starch) but the answer was actually carbohydrate that was stored in the form of starch. In item no. 8 (----------- absorbs light energy for photosynthesis), 60% students wrongly attempted the item and only 40% students’ responded it ‘chlorophyll’ which was the correct response. Solar energy converts into chemical energy by ------------ process was the stem of item no. 9 was responded by 60% of students found wrong. Similarly, to respond the item no. 10, 80% students responded the item wrongly. Item no. 11 wrongly responded by 60% students but rightly responded by 40% of students. In addition to that, item no. 12 & 13 correctly responded by 0% and wrongly responded by 100% of students. In case of item no. 14 & 15, only 0% and 40% correctly responded the item. It was resulted that 60% - 100% students has misconception and wrongly responded the item ranged item no. 1-15. This was due to pre-conceived notion, non-scientific belief, and conceptual misunderstanding. Hence, there were misconceptions of students in science.
Testing of Hypothesis 2: There are significant effects of Neural Network Artificial Intelligence Approach on the prediction of learners’ learning outputs.
Table-2.1 N, Mean & SD of output layer, input layer, and Hidden layers
Output layer 5
9.00
2.236
Input layer 5
3.60
.548
1st Hidden layer 5
4.40
.894
2nd Hidden layer 5
2.80
.447
3rd Hidden layer 5
1.80
.447
Table-2.2 Linear Regression of output layer, input layer, and Hidden layers
Model R
R Square
Adjusted R Square
Std. Error of the Estimate
1
.612a
.375
.167
2.041
2
1.000b
1.000
1.000
.000
a. Predictors: (Constant), Input layer b. Predictors: (Constant), Input layer, 1st Hidden layer c. Dependent Variable: Output layerTable-2.3 ANOVAc of output layer, input layer, and Hidden layers
Model 1
Regression
Residual
Total
Table-2.4 Coefficientsa of output layer, input layer, and Hidden layers
Model Unstandardized
CoefficientsStandardized Coefficients
t
p
B
Std. Error
Beta
1
(Constant) Input layer 2
(Constant) Input layer 1st Hidden layer Table 2.1 reveals that the output (9.00 ± 2.23 mean) was higher than (3.60 ± 0.54 mean), (4.40 ± 0.89 mean), (2.80± 0.44 mean) and (1.80 ± 0.44 mean) of input layer, first hidden layer, second hidden layer and third hidden layer respectively. Similarly, the regression of output layer on the basic model (R = 0.612, R2 = 0.375 and adjusted R2 = 0.167 P>0.05) revealed statistically not significant relationship with input layer (β= 0.612 P>0.05). The output regression model (R = 1.00, R2 = 1.00, adjusted R2 =1.00, P<0.05) was resulted significant and positive relationship with input layer and first hidden layer (β= -1.22 P< 0.05) and (β=2.00 P< 0.05) respectively. The F value of output and input layer (1/4 1.80 P>0.05) was not significant whereas the relationship among output layer, input layer and first hidden layer F= (2/4 10.00 P <0.05 was significant (see table 2.2, 2.3 & 2.4). Hence, the hypothesis was accepted and there was a significant effect of Neural Network Artificial Intelligence Approach on the prediction of learners’ learning outputs.
Testing of Hypothesis 3: There are significant effects of Neural Network Artificial Intelligence Approach on achievement and retention of science learning.
Table-3.1 Descriptive statistics of students pre test, post test and delayed test scores
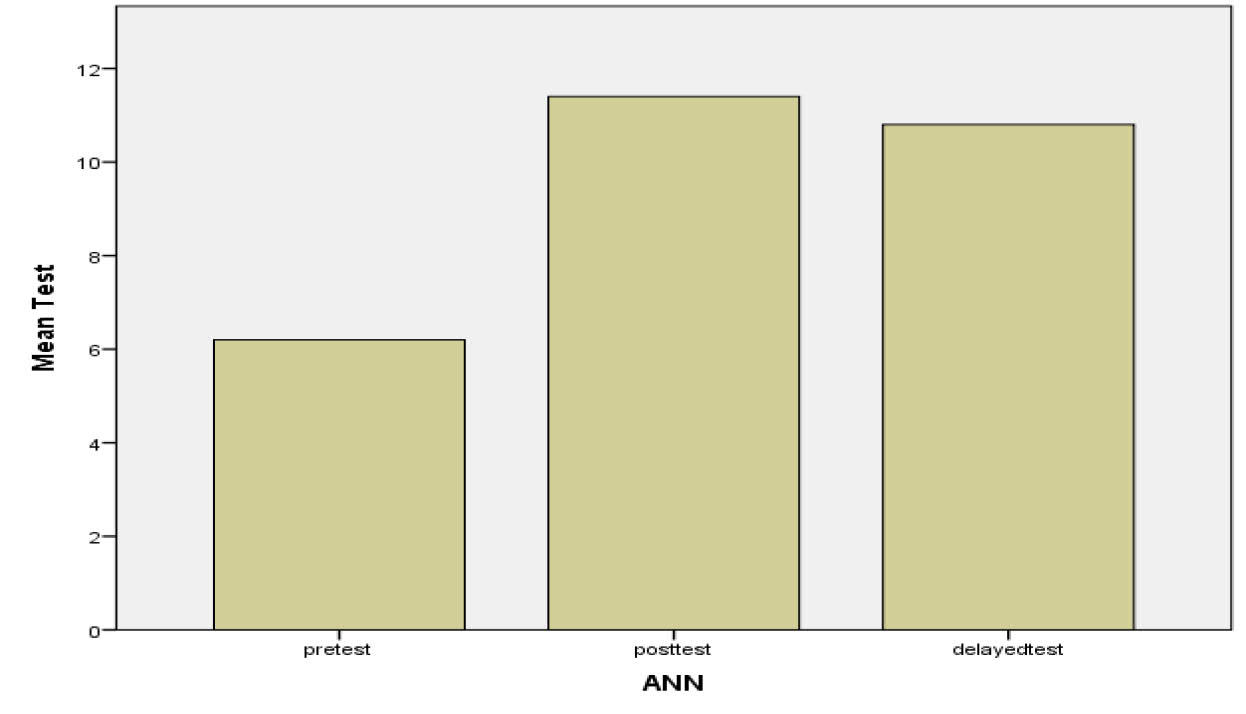
Pretest 5 6.20 .837 .374 Posttest 5 11.40 .548 .245 Delayed test 5 10.80 .447 .200 Total 15 9.47 2.475 .639 Table 3.1 depict the mean and SD of students’ pre test, post test and delayed test scores before and after exposed to Neural Network Artificial Intelligence Approach in science learning. Mean of pretest score (6.20 ±.837) was smaller than the mean of posttest (11.40 ± .548) and delayed test (10.80 ±.447).
Table-3.2 Test of Homogeneity of Variances
1.412
2
12
.281
Table-3.3 ANOVA of students pre test, post test and delayed test scores
Between Groups
80.933 2 40.467 101.167 .000 Within Groups
4.800 12 .400 Total
85.733 14 Output 2 shows the results of Levene’s test in table 3.2 for pre test, posttest, and delayed test score assessed before and after exposed to neural network artificial intelligence approach of science learning. Levene’s test is significant, indicating that the group variances were not equal (hence the assumption of homogeneity of variance is likely been violated). There was a significant effect of posttest, and delayed test score assessed before and after exposed to neural network artificial intelligence approach of science learning. The F(2,12)=101.167, p=.000 was significant. Hence, the hypothesis was accepted and there was significant effects of neural network artificial intelligence approach on achievement and retention of science learning (see table 3.3).
Table-3.4 Scheffe Multiple Comparisons of students pre test, post test and delayed test scores
(I) ANN (J) ANN Pretest Posttest -5.200* .400 .000 -6.32 -4.08 Delayed test -4.600* .400 .000 -5.72 -3.48 Posttest Pretest 5.200* .400 .000 4.08 6.32 Delayed test .600 .400 .357 -.52 1.72 Delayed test Pretest 4.600* .400 .000 3.48 5.72 Posttest -.600 .400 .357 -1.72 .52 *. The mean difference is significant at the 0.05 level.Table 3.4 reveals the Scheffe Multiple Comparisons of students pre test, post test and delayed test scores.The mean difference between pretest and posttest (m= -5.200,SDError=.400 p<.05), and pretest and delayed test (m= -4.600,SDError=.400 p<.05) was also significant. This was because of the effects of neural network artificial intelligence approach on achievement and retention of science learning.
Figure 5. Histogram of pre-test, post-test and Delayed test mean score
Figure 5 interpreted the pre-test, post-test and delayed –test score. X-axis represents types of test and in the Y-axis mean of the test score. The pre-test mean 6.20 showed smaller than the posttest mean 11.40 and the delayed-test mean 10.80.