|
Asia-Pacific Forum on Science Learning and Teaching, Volume 16, Issue 1, Article 8 (Jun., 2015) |
The questionnaire was conducted to attempt to ascertain information about the image of scientists and source of scientist image. The questionnaire was administered by the class teacher in one of his/her lessons from 4 different countries. The teachers were asked not to give any further directions to students and no time limit was set for drawing the pictures. All teachers reported that students completed the task in 25 minutes or less.
After that, all the drawings were coded and then scored using the Barman’s (1996) DAST Checklists. To address inter-rater reliability issues, all drawings were scored by two colleagues who have extensive background and experience with coding and scoring such drawings. Frequency analysis was completed on the scores of subsets examining the differences between the scores given by the researchers to the drawings. The instrument's reliability is KR-20 = .72. The validity was determined via review of drawings by author. The second part of questionnaire regarding source of scientist image was measured by ANOVA to represent descriptive analyses and any statistical differences between groups. The reliability of the instrument was documented at .89.
The pictures were evaluated using a scoring sheet developed using the 15 standard indicators suggested in the study by Barman (1996). The drawings were coded by the author and his 2 collogues. Each drawing was rated for specific stereotypic images and additional information obtained from the student narratives by using DAST-C (Table 3). The literature says, scientists depicted as a white male, middle-aged or older, wearing a lab coat and glasses and featuring some type of facial hair (Barman, 1996-1997-1999; Bodzin, & Gehringer, 2001; Chambers 1983; Finson, 2002-2003; Finson, Beaver, & Cramond 1995; Finson, Pedersen, & Thomas, 2006; Flick, 1990; Fort & Varney 1989; Fung, 2002; Huber & Burton 1995; Moseley, & Norris, 1999; Odell, Hewitt, Bowman, & Boone, 1993; Pedersen, & Thomas, 1999; Pedersen & Turkmen, 2005; Rosenthal, 1993; Ryder, Leach, & Driver, 1999; Schibeci & Sorensen, 1983; She, 1995-1998; Song, & Kim, 1999; Symington, & Spurling, 1990; Thomas, & Pedersen, 1998; Thomas, Pedersen, & Finson, 2001; Turkmen, 2008).
This study showed that students perceived scientists who have “facial hair” (E: 45%, US: 43%, T: 48%), and indicator of “symbols of research” (E: 75%, US and T:76%) drawn laboratory equipment, including test tubes, various types of flasks, beakers and burners with flames and “symbols of knowledge” (E: 80%, US: 79%, T: 77%) drawn books, shelves or stationery, were almost same percentage. Moreover, there often is a lack of perspective in “Indications of Danger” (E: 0%, US: 1%, T: 2%) and “Mythic Stereotypes (Frankenstein creatures, etc.)” (E: 0%, US: 0%, T: 0%) and “Indications of Secrecy” (E: 0%, US: 0%, T: 1%).
Table 3. Pre-service teachers' stereotypic images of a scientist
Barman’s Indicators (1996)
E
US
T
1. Scientist Wearing a Lab Coat
69%
60%
81%
2. Scientist Wearing Eyeglasses
63%
65%
93%
3. Scientist With Facial Hair
45%
43%
48%
4. Symbols of Research (instruments, lab equipment, etc.)
75%
76%
76%
5. Symbols of Knowledge (books, clip boards, pens in pockets, etc.)
80%
79%
77%
6. Technology (e.g. telephone, TV, computers, etc.)
54%
71%
49%
7. Relevant Captions (formula, classification, "eureka", etc.)
75%
66%
51%
8. Male Gender
59%
60%
74%
9. Caucasian(s)
100%
70%
100%
10. Scientist in Middle Aged/Elderly
68%
65%
88%
11. Scientist has Mythic Stereotypes (Frankenstein creatures, etc.)
0
0
0
12. Indications of Secrecy (Warnings of "private," etc.)
0
0
1%
13. Scientist is Working in Lab
74%
61%
88%
14. Indications of Danger
0
1%
2%
15. Open comments related to dress items, neckties, hair style, smile/frown, etc.
• Depicted scientists wearing regular clothing (e.g., blue jeans, T-shirt)
• Drew the scientist with a smile
31%
60%
40%
55%
15%
32%*E: European, US: American, T: Turkish pre-service teachers
Although there groups of Pre-service teachers have different cultural lives, they have almost same stereotypic images of a scientist in their minds for all indicators, except “Mythic Stereotypes,” “Indications of Secrecy and Danger”, because frequencies showed that all indicators for three groups are over %50 percentage.
Ethnic minority representation was practically nonexistent in European countries and Turkey because of “Caucasian(s)” indicator. Caucasian refers to people native to the Caucasus but it has become interchangeable with any number of “white” populations. All scientists are Caucasian, except Americans depicted 30% of their drawings include black and/or Asian scientists. One possible explanation for Turkish pre-service teachers is all Turks are Caucasian and they probably have never seen any black or Hispanic or Asian scientists in their schools or social lives, but it is very interesting for European pre-service teachers (Table 3).
On the other hand, American and European pre-service teachers frequency results are very close; and less perspective on “scientist wearing eye glasses” (E: 63%, US: 65%, T: 93%), “male gender” (E: 59%, US: 60%, T: 74%), “Scientist in Middle Aged/Elderly” (E: 68%, US: 65%, T: 88%); and more perspective on “Drew the scientist with a smile” (E: 60%, US: 55%, T: 32%), than Turkish pre-service teachers’.
Meanwhile all three groups have different percentage of DAST indicators on “Scientist Wearing a Lab Coat” (E: 69%, US: 60%, T: 81%) and opposite indicator “wearing regular clothes”, suits, blue jeans, T-shirt, (E: 31%, US: 40%, T: 15); “Relevant Captions (formula, classification, "eureka", etc.)” (E: 75%, US: 66%, T: 51%), “Scientist is Working in Lab” (E: 74%, US: 61%, T: 88%).
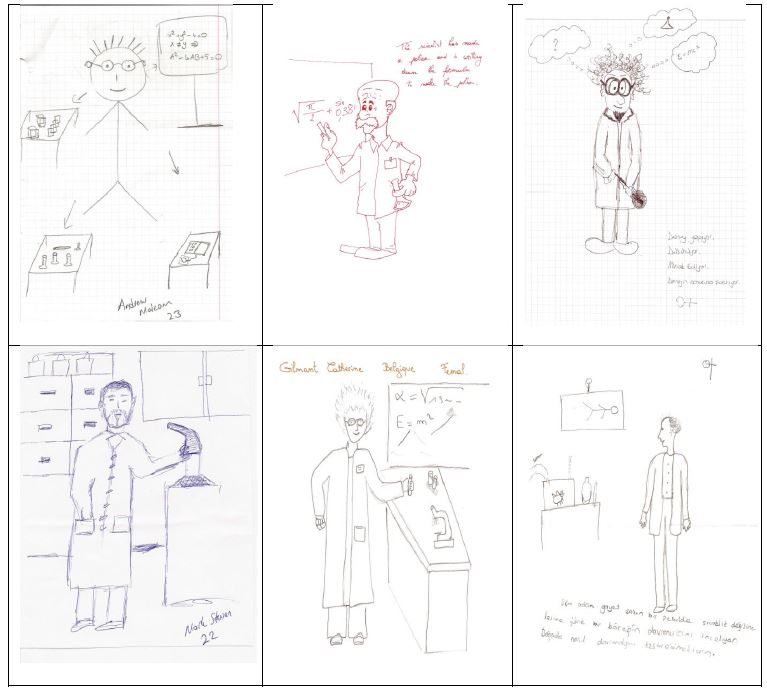
The interesting result was that mostly all image of scientists in three groups of pre-service teachers’ minds works in a laboratory and stands behind or by the side of a table but very few are outside. Moreover, scientist stands alone in an environment (generally laboratory) surrounded by objects of research or knowledge and barely included other people. Another interesting result was noted that both pre-service teachers pay close attention scientists’ contributions to the well-known of mankind, such as, Albert Einstein, Isaac Newton , Graham Bell, and Thomas Edison as a male scientists (figure 1).
Figure 1. Pre-service teachers’ drawings
In the second part of questionnaire, pre-service teachers answered based on items listed on the instrument “Where they obtain most of their information about scientist”. All three groups think all sources of image of scientist are important and their scores are over 2 point. In three groups, European pre-service teachers have highest mean scores; Turkish pre-service teachers have lowest mean scores for media (E: 2,8389, US: 2,7143, T: 2,2857), friends (E:2,9815, US: 2,8868, T: 2,4307) and parents (E: 3,0914, US: 2,9739, T: 2,4062). Oppositely Turkish pre-service teachers has highest mean score, Europeans has lowest mean score for teachers (E: 3,3272, US: 3,4529, T: 3,8519) as a source of information about Scientist.
Despite only teachers, as a source, are very important source for Turks, possible reason of that learning is strictly related to school and teachers. Like lifelong learning, inquiry and social learning theories are internalization processes in Turkish education system. The proof is that as mentioned above the international competitions, like PISA TIMMS. Oppositely, the American European pre-service teachers think media, friends, and parent are very important as much as teachers (Table 4).
Table 4. Descriptive analyzes of where pre-service teachers receive information about scientist: Individuals
N
Min.
Max.
M
sd
European pre-service teachers
media
162
1,00
4,00
2,8389
,86333
friends
2,9815
,80736
parents
3,0914
,82307
teachers
3,3272
,78677
American pre-service teachers
media
68
1,00
4,00
2,7143
,50531
friends
2,8868
,76393
parents
2,9739
,40746
teachers
3,4529
,70008
Turkish pre-service teachers
media
105
1,00
4,00
2,2857
1,05351
friends
2,4307
1,00252
parents
2,4062
1,02304
teachers
3,8519
,41952
M: mean, sd: standard deviation
According to analyze of ANOVA - Post Hoc Tests (Table 5), the difference in that section between European and Turkish pre-service teacher; the Americans and Turkish pre-service teachers; were marginally significant (all P values = ,000), on the other hand there could find any statistical difference between the American and European pre-service teachers (P values = ,063 for media, ,076 for friends, ,082 for parents, ,061 for teachers)
Table 5. Multiple comparisons of groups about receiving information about scientist dependent variable: Score
Groups
Mean difference
Std. error
Sig.
Media
1
2
,1246
1,054
,063
3
,6032
,986
,000
2
1
-,1246
1,054
,063
3
-,1714
,675
,000
3
1
-,6032
,986
,000
2
,1714
,675
,000
Friends
1
2
,0947
1,132
,076
3
,5508
,825
,000
2
1
-,0947
1,132
,076
3
,4521
,572
,000
3
1
-,5508
,825
,000
2
-,4521
,572
,000
Parents
1
2
,1175
,667
,082
3
,8552
1,123
,000
2
1
-,1175
,667
,082
3
,5277
,885
,000
3
1
-,8552
1,123
,000
2
-,5277
,885
,000
Teachers
1
2
-,1257
,467
,061
3
-,5247
,849
,000
2
1
,1257
,467
,061
3
-,3990
,721
,000
3
1
,5247
,849
,000
2
,3990
,721
,000
p > 0.05, Group1: European pre-service teachers, Group2: American pre-service teachers, Group3: Turkish pre-service teachers
The analyzing of “The Most Frequent Way Students Study/Learn About Scientist” showed that Turkish pre-service teachers have lowest mean scores for all questions. All groups of pre-service teachers’ images of scientists were influenced to a considerable degree by teachers (E: 2,90; US: 2,73; T: 2.48), the content of science textbooks (E: 2.88, US: 2.78, T: 2.69) and books (E: 2.87, US: 3.12, T: 2.51), this study illustrated the possible impact of the curriculum. However, the statements of “Students write papers about scientist” (M: 1.88) and “Students participate in field trips related to scientists” (M: 1.23) were seen as the least likely manner (never) and “Students read about scientists in an article or journal,” and “Students complete projects on scientists” were ranked in “sometimes” manner by which Turkish pre-service teachers learn about scientists. On the contrary, The American and European elementary pre-service teachers do not have the least likely manner (never) and these, question 2 and 6, are thought in “frequently” manner (Table 6).
Table 6. Descriptive analyzes of the most frequent way students study/Learn about scientist
Questions
E
US
T
M
sd
M
sd
M
sd
1. A teacher talks about scientists in class.
2,8951
,90963
2,7289
,83936
2,4802
,96472
2. Students read about scientists in an article or journal.
2,8803
,88463
2,7822
,78821
2,2001
1,1042
3. Students write papers about scientist.
2,9512
1,0196
3,0119
,69962
1,8848
,79022
4. Students read about scientists in books (other than textbooks).
2,8724
,80443
3,1246
,62621
2,5143
,90772
5. Students read about scientists in textbooks.
2,8835
,89063
2,7828
,72178
2,6933
,97681
6. Students complete projects on scientists.
2,9834
1,09263
3,4333
,59761
2,0544
,84672
7. Students participate in field trips related to scientists.
2,3937
,90963
2,4543
1,0832
1,2341
,67812
Average of all questions
2,837
2,9315
2,0968
It was found that the difference is judged to be no statistically significant difference between European and Turkish pre-service teachers in question 4 (0,18 > 0,05), question 5 (0,111 > 0,05) but in question 1 (,038 < 0,05), question 2 (,044<0,05), question 3 (,013<0,05), question 6 (,002<0,05) and question 7 (,006<0,05) we see statistically significant difference.
There is no statistically significant difference between the American and Turkish pre-service teachers in only question 5 (0,388 > 0,05) but in all other questions there are.
On the other hand, significant differences between Europeans and the Americans was just found only in two question 4 (0,03 < 0,05) and question 6 (0,008< 0,05) and the Americans has higher mean scores than Europeans.
American pre-service teachers read more books about scientists and do more projects about them than Europeans. In the present study, 107 biology projects participating in secondary education students to the Bursa Region Coordinator ship of TUBITAK-BİDEB were evaluated. The distribution of the projects applying to competition between 2009 and 2012 by years is given in the Table 2.
Table 7. Multiple comparisons of groups about “The most frequent way students study/Learn about scientist”
Dependent variable: SCORE
Groups
Mean difference
Std. error
Sig.
1. A teacher talks about scientists in class
1
2
,1662
,332
,123
3
,4149
,566
,038
2
1
-,1662
,332
,123
3
,2487
,639
,048
3
1
-,4149
,566
,038
2
-,2487
,639
,048
2. Students read about scientists in an article or journal
1
2
,0981
,484
,621
3
,6802
,839
,044
2
1
-,0981
,484
,621
3
,5821
,439
,036
3
1
-,6802
,839
,044
2
-,5821
,439
,036
3. Students write papers about scientist
1
2
-,0607
,284
,217
3
1,0664
,997
,013
2
1
,0607
,284
,217
3
1,1271
1,132
,001
3
1
-1,0664
,997
,013
2
-1,1271
1,132
,001
4. Students read about scientists in books (other than textbooks).
1
2
-,2522
,583
,03
3
,3581
,649
,18
2
1
,2522
,583
,03
3
,6103
,887
,047
3
1
-,3581
,649
,18
2
-,6103
,887
,047
5. Students read about scientists in textbooks
1
2
,1007
1,332
,137
3
,1902
1,032
,111
2
1
-,1007
1,332
,137
3
,1895
1,002
,388
3
1
-,1902
1,032
,111
2
-,1895
1,002
,388
6. Students complete projects on scientists.
1
2
-,4499
,832
,008
3
,9290
,982
,002
2
1
,4499
,832
,008
3
1,3789
,732
,003
3
1
-,9290
,982
,002
2
-1,3789
,732
,003
7. Students participate in field trips related to scientists.
1
2
-,0607
,984
,067
3
1,1596
,792
,006
2
1
,0607
,984
,067
3
1,2202
,532
,021
3
1
-1,1596
,792
,006
2
-1,2202
,532
,021

Copyright (C) 2015 HKIEd APFSLT. Volume 16, Issue 1, Article 8 (Jun., 2015). All Rights Reserved.