|
Asia-Pacific Forum on Science Learning and Teaching, Volume 16, Issue 1, Article 9 (Jun., 2015) |
The data set
The final Chinese version of the 35-item SLEI was administrated to 2061 students studying the Hong Kong Junior Secondary Science Curriculum in Grades 7, 8, and 9 with percentages being 6, 63, and 31 respectively. In fact, it is very common that a teacher teaches the same science subject at all three grade levels, and students of all these three grade levels share the same laboratory and use the same textbook series. In terms of the laboratory learning environments, the three grade levels are indeed very similar. In the sample of the study, male and female students were in the ratio of 1: 0.82. It included both high and low academic achievers. Some students use English as a medium of instruction while others use Chinese as a medium of instruction. This sample represented a typical profile of the student population in Hong Kong. After a preliminary screening to filter out invalid questionnaires, the number of valid responses was 1932. This formed the data set for analysis in the main study.
To help us interpret the data, teachers of the participating schools were invited for interviews. Finally two teachers were interviewed over the telephone and four teachers attended a group interview. The interview questions were asked with reference to the 35 items of the SLEI questionnaire. Teachers were asked to describe the actual and preferred laboratory practices and to elaborate on their views. The interviews lasted for about one hour.
Data analysis and results
Reliability and factor structure
The data set of the student was checked for reliability. The Cronbach alpha coefficients were listed in Table 2.
Table 2. The reliability coefficients of the of SLEI scales
Scale
No. of Items
Alpha Reliability
Actual
Preferred
Student Cohesiveness
7
0.71
0.72
Open-Endedness
7
0.55
0.62
Integration
7
0.64
0.52
Rule Clarity
7
0.54
0.47
Material Environment
7
0.73
0.81
The reliability coefficients of Student Cohesiveness and Material Environment scales were greater than 0.7 indicating that these two scales were generally reliable. However the reliability coefficients of the other three scales ranged from 0.47 to 0.64 suggesting that items in these three scales were inconsistent. An examination of the item-total correlations was done to identify items with which the correlations with their own scales were low (Table 3). Many of these items were the reversed-worded items. Barnette (1999) found that a scale with reversed-worded items mixed with positively worded items could have strong effects on Cronbach’s alpha coefficients. When mixed-worded items of a unidimensional scale were subjected to exploratory factor analysis, separate factors associated with positively and negatively worded items were often found (Marsh, 1996; Barnette, 2000; Brown, 2003). This effect, which also happened in other social science research, appeared to be more pronounced in cross-cultural studies (Eastman, et al., 1997; Cheng & Hamid, 1997; Lai & Yue, 2000; Suzuki, et al., 2000; Wong, et al., 2003).
Table 3. Item-total correlations and factor loadings of all 35 items of the SLEI scales
Scale
Item no.
Item-Total Correlation
Factor Loading
Actual
Preferred
Actual
Preferred
Student Cohesiveness
6R*
0.29
0.20
0.28
0.12
11
0.47
0.58
0.62
0.72
16
0.49
0.47
0.58
0.61
21
0.49
0.55
0.63
0.72
26R*
0.22
0.17
0.19
0.09
31
0.52
0.57
0.67
0.73
Open-Endedness
2*
0.17
0.40
0.30
0.60
7
0.37
0.52
0.49
0.63
12*
0.18
0.37
0.25
0.47
17
0.45
0.49
0.61
0.59
22
0.43
0.49
0.58
0.58
27R*
-0.09
-0.32
-0.05
-0.37
32
0.45
0.51
0.60
0.65
Integration
3R +
0.42
0.34
0.62
0.68
8R*
0.38
0.25
0.27
-0.04
13
0.36
0.29
0.53
0.60
18
0.30
0.28
0.55
0.63
23R*
0.30
0.01
0.19
-0.29
28
0.40
0.36
0.65
0.68
33R*
0.34
0.27
-0.24
-0.02
Rule Clarity
4
0.38
0.35
0.59
0.57
9R*
0.04
-0.08
-0.04
-0.29
14
0.43
0.35
0.57
0.46
19
0.43
0.36
0.63
0.63
24R*
0.10
-0.06
0.02
-0.26
29
0.33
0.36
0.51
0.60
34
0.26
0.37
0.46
0.62
Material Environment
5R +
0.50
0.54
0.60
0.59
10*
0.25
0.42
0.29
0.46
15R +
0.48
0.60
0.57
0.68
20R +
0.53
0.62
0.63
0.69
25R +
0.49
0.61
0.59
0.69
30
0.41
0.53
0.49
0.60
35
0.49
0.59
0.60
0.66
R Items are negatively worded in original version of the SLEI scales
(+) Items changed to positive worded items after pilot test
* Items were deleted in calculating scale meansThe SLEI has previously been validated and applied in many studies (Fraser, McRobbie & Giddings 1993; Fisher, Henderson & Fraser, 1997; Fraser & McRobbie, 1995; Wong & Fraser 1996; Lee & Fraser 2002; Tsai 2003). The factor structure of the items was known. Therefore a prior assumption of the loading of the items on different factors could be made. To find out the item factor loadings, a confirmatory factor analysis using AMOS was conducted. Each item was allowed to load on one factor only. The errors associated with all items were posited to be uncorrelated. At first, each scale was tested separately. The model fit of the confirmatory factor analysis was evaluated by the Goodness-of-fit (GFI), Comparative Fit Index (CFI), and Root Mean Square Error of Approximation (RMSEA). GFI and CFI vary between 0 and 1. A value over 0.9 indicates an adequate fit whereas a value above 0.95 is a good model fit. A RMSEA value between 0.10 and 0.05 is an acceptable fit. If RMSEA is less than 0.05, it suggests a good model fit. The fit indices were shown in Table 4. In the study, the fit indices were generally acceptable except the Integration scale, whose CFI indices were the only fit indices close to adequate fit. The factor loadings were shown in Table 3. It was found that items having small item-total correlations were generally low in factor loadings. Therefore eleven items (items 6, 26, 2, 12, 27, 8, 23, 33, 9, 24, 10) with relatively low item-total correlations and factor loadings in the perceptions of either actual or preferred environments on their own scale were removed in the subsequent analysis.
Table 4. Fit indices for the confirmatory factor analysis of all 35 items of the SLEI scales
Scale
No. of item
Actual
Preferred
GFI
CFI
RMSEA
GFI
CFI
RMSEA
Student Cohesiveness 7
0.997
0.947
0.072
0.957
0.915
0.107
Open-Endedness 7
0.973
0.876
0.078
0.972
0.931
0.081
Integration 7
0.890
0.653
0.161
0.893
0.703
0.164
Rule Clarity 7
0.965
0.853
0.091
0.957
0.854
0.105
Material Environment
7
0.994
0.989
0.030
0.987
0.981
0.051
The remaining 24-item data set was fitted again by each scale separately. Table 5 showed that the fit indices were improved to a very good fit. When a five-factor orthogonal model was tested, the fit indices were not satisfactory. If the five scales were allowed to correlate, this model fitted the data well (Table 5). The correlations among the five scales were shown in Table 6.
Table 5. Fit indices for the confirmatory factor analysis of the remaining 24 items of the SLEI scales
Scale
No. of item
Actual
Preferred
GFI
CFI
RMSEA
GFI
CFI
RMSEA
Student Cohesiveness 5
0.996
0.993
0.042
0.997
0.997
0.033
Open-Endedness
4
0.997
0.992
0.045
0.999
0.998
0.029
Integration
4
0.999
0.998
0.027
0.998
0.997
0.035
Rule Clarity
5
0.997
0.993
0.031
0.996
0.991
0.039
Material Environment
6
0.997
0.995
0.025
0.990
0.984
0.055
Orthogonal model
24
0.795
0.618
0.100
0.722
0.620
0.117
Correlated model
24
0.937
0.904
0.051
0.940
0.936
0.049
Table 6. Correlations among scales in the correlated model fit
Scale
Student Cohesiveness
Open-Endedness
Integration
Rule Clarity
Material Environment
Actual
Preferred
Actual
Preferred
Actual
Preferred
Actual
Preferred
Actual
Preferred
Student Cohesiveness
1.00
1.00
Open-Endedness
0.04
0.63
1.00
1.00
Integration
0.76
0.89
0.23
0.74
1.00
1.00
Rule Clarity
0.82
0.85
0.02
0.64
0.93
0.94
1.00
1.00
Material Environment
0.74
0.88
0.18
0.67
0.87
0.91
0.93
0.91
1.00
1.00
When correlations were allowed among all scales, the final factor loadings of the 24 items were shown in Table 7. For this very restrictive model of which 120 possible factor loadings (24 items x 5 factors), 96 of them were set to zero. All the three fit indices, GFI, CFI, and RMSEA, indicated that it was a good fit. The percentage of variance explained by each factor was shown at the bottom of Table 7. The perceptions of the actual and preferred environments accounted for 35.08% and 41.06% respectively.
Table 7. Standardized factor loadings of the correlated model fit
Item no.
Standardized factor loading
Student Cohesiveness
Open-Endedness
Integration
Rule Clarity
Material Environment
Actual
Preferred
Actual
Preferred
Actual
Preferred
Actual
Preferred
Actual
Preferred
1
0.71
0.74
11
0.64
0.73
16
0.57
0.62
21
0.64
0.71
31
0.69
0.74
7
0.49
0.60
17
0.62
0.59
22
0.59
0.56
32
0.59
0.71
3
0.62
0.67
13
0.58
0.60
18
0.54
0.64
28
0.66
0.69
4
0.58
0.57
14
0.57
0.48
19
0.62
0.69
29
0.50
0.56
34
0.50
0.60
5
0.58
0.59
15
0.57
0.68
20
0.60
0.67
25
0.59
0.68
30
0.56
0.64
35
0.58
0.67
Eigenvalue
2.10
2.51
1.32
1.52
1.44
1.68
1.54
1.70
2.02
2.57
% of variance
8.76
10.46
5.51
6.34
6.00
7.02
6.42
7.08
8.40
10.70
All factor loadings not shown are set to zero. The sample consisted of 1932 students.
After the factor structure was checked by confirmatory factor analysis, the reliability was re-calculated using the remaining 24 items for both individual and class means as the unit of analysis. The reliability coefficients showed considerable improvement (Table 8).
Table 8. Internal consistency reliability (Cronbach alpha coefficient), discriminant validity (mean correlation with other scales) and ability to differentiate between classrooms (ANOVA results) for the individual as the unit of analysis
Scale
No. of items
Unit of analysis
Alpha reliability
Mean correlation with other scales
ANOVA eta2
Actual
Preferred
Actual
Preferred
Actual
Student Cohesiveness
5
individual
0.78
0.83
0.44
0.64
0.145**
class mean
0.93
0.96
0.54
0.84
Open-Endedness
4
individual
0.66
0.71
0.09
0.48
0.153**
class mean
0.87
0.84
-0.07
0.66
Integration
4
individual
0.69
0.74
0.50
0.66
0.15**
class mean
0.93
0.92
0.64
0.85
Rule Clarity
5
individual
0.68
0.72
0.49
0.62
0.167**
class mean
0.91
0.88
0.57
0.81
Material Environment
6
individual
0.75
0.82
0.50
0.66
0.155**
class mean
0.91
0.95
0.57
0.83
** p < 0.01
The sample consisted of 1932 students in 58 classes.
The eta2 statistic (which is the ratio of 'between' to 'total' sums of squares) represents the proportion of variance explained by class membership.Mean correlation with other scales was used as a convenient index of discriminant validity. The values ranged from -0.07 to 0.64 in the actual environment and 0.48 to 0.85 in the preferred environment. The values suggested there were correlations among some of the scales which were also found in the confirmatory factor analysis. It was noted the mean correlation calculated from Table 6 was larger because in confirmatory factor analysis, there was no cross-loadings of the items on other scales. Any correlation that existed among items had to be taken up by the factor correlation (Brown 2006, p.92). The correlations among the scales in the preferred environment were larger than in the actual environment.
The ability of the SLEI to differentiate perceptions of students in different classes is an important characteristic of the measuring instrument. Students of the same class should perceive the scales relatively similar and the mean within-class should vary from class to class. The sensitivity of the scales was checked by one-way ANOVA with each scale as dependent variables and class as an independent variable. The eta squared values ranged from 0.145 to 0.167 indicated that the scales were able to differentiate students’ perceptions between different classes.
Students’ perceptions of the laboratory learning environments
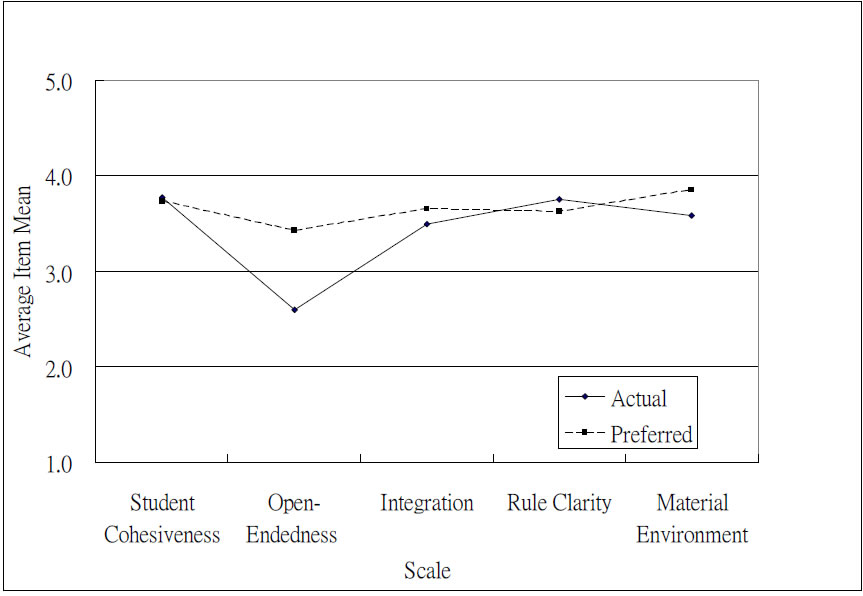
To find out the students’ perceptions of the actual and preferred laboratory learning environments, the average item means and the differences of the five scales were calculated. T-test and Cohen’s d effect size were used to assess the statistical significance and the magnitude of the effect (Table 9). The results in Table 9 indicated that there were statistically significant differences (p < 0.01) in the students’ perceptions of the actual and preferred laboratory learning environments except the Student Cohesiveness scale. The effect size of the differences ranged from 0.05 (small effect) to 2.99 standard deviation (large effect). When the unit of analysis was individual, the largest effect (-1.03 standard deviation) was found in Open-Endedness scale. The mean score of the Open-Endedness scale (2.59) was the lowest in the actual environment. A rating between 2 and 3 meant that the events as described by the items on the scale happened between “Seldom” and “Sometimes”. The mean score of the Open-Endedness scale in the preferred environment (3.43) was also the lowest among all the scales. A rating between 3 and 4 meant that the events as described by the items on the scale happened between “Sometimes” and “Often”. The largest differences among all the scales suggested that the students were not satisfied with the current practice and preferred a more open approach in the laboratory learning activities. The mean score of the Student Cohesiveness scale was the highest of all the scales in the actual environment (3.77) and the second highest (3.73) in the preferred environment. The results suggested that students perceived good relationships among the peers. The difference between the perceptions of the actual and preferred environments was not statistically significant and the effect size (0.05 standard deviation) was also small. Practically the perceptions of the actual and preferred environments of this scale were the same. Small but notably differences were found in the Integration scale (-0.22 standard deviation), the Rule Clarity scale (0.19 standard deviation), and the Material Environment scale (-0.36 standard deviation). The mean scores of the Integration scale (3.49 in “actual” and 3.65 in “preferred”), the Rule Clarity scale (3.75 in “actual’ and 3.63 in “preferred”), and the Material Environment scale (3.58 in “actual’ and 3.85 in “preferred”) in the actual and preferred environments were all between “Sometimes” and “often”. Figure 1 plotted the average item means of the scales in the actual and preferred environments of the 1932 students.
Table 9. Average item mean, average item standard deviation and the difference between students’ perceptions of the actual and preferred laboratory environments on the SLEI scales
Scale
No. of item
Unit of analysis
Average item mean
Average item standard deviation
t
Effect size Cohen's d
Actual
Preferred
Actual
Preferred
Student Cohesiveness
5
individual
3.77
3.73
0.69
0.84
2.25
0.05
class mean
3.74
3.70
0.28
0.30
1.32
0.12
Open-Endedness
4
individual
2.59
3.43
0.78
0.84
-36.29**
-1.03
class mean
2.60
3.42
0.31
0.24
-16.66**
-2.99
Integration
4
individual
3.49
3.65
0.65
0.76
-9.36**
-0.22
class mean
3.47
3.63
0.26
0.28
-5.30**
-0.58
Rule Clarity
5
individual
3.75
3.63
0.63
0.72
7.99**
0.19
class mean
3.73
3.61
0.27
0.23
4.49**
0.47
Material Environment
6
individual
3.58
3.85
0.67
0.80
-13.79**
-0.36
class mean
3.57
3.82
0.27
0.30
-7.03**
-0.88
** p < 0.01
Sample size = 1932 students
Figure 1. Average item mean of students’ perceptions of the actual and preferred laboratory environments on the SLEI scales