|
Asia-Pacific Forum on Science Learning and Teaching, Volume 16, Issue 1, Article 11 (Jun., 2015) |
In the present study, 107 biology projects participating in secondary education students to the Bursa Region Coordinator ship of TUBITAK-BİDEB were evaluated. The distribution of the projects applying to competition between 2009 and 2012 by years is given in the Table 2.
Table 2. The number of projects in biology
Biyoloji Alanındaki Yarışma Süreci
The Number of Projects
Total
2009
2010
2011
2012
Comer To Regional Science Board
25
19
27
36
107
Invited To Bursa Regional Exhibition
8
9
5
9
31
Invited To Turkey Selections
1
1
1
2
5
The Award-Winning By Being Placed In The First Fifty In Turkey Selections
1
1
1
2
5
According to the Table 2, 31 of 107 projects coming to the Regional Science Board were invited to Bursa Regional Exhibition. Of these projects, 5 projects were found worthy of being exhibited in Ankara for competition across Turkey. All the relevant projects won nationwide prizes.
Table 3 lists the distribution of the school types in current secondary education by municipality. From the data in the table it may be inferred that public schools have a share of 93.08%, whereas private high schools make up 6.92%. Among the public schools, it is seen that Vocational High Schools have a share of 44.02%, Anatolian High Schools 18.37%, Science High Schools 2.67%, and regular high schools 20.6%. Among private schools, private Science High Schools have a share of 1.45% whereas private Anatolian High Schools have 0.97%, and private regular high schools have 4.5%.
Again according to Table 3, it is seen that 73 out of 107 biology projects (68.2%) hailed from public schools, whereas the remaining 34 (31.8%) were submitted by participants from private schools. As for private schools, 33 projects (30.8%) came from Anatolian High Schools, 6 (5.6%) from regular high schools, 17 (15.9%) from Science High Schools, and 16 (14.9%) from Vocational Schools. These ratios show that although the number of public schools was higher than other organizations, the participation was lower at these schools. These data also show that the number of project applications is not proportional to the number of schools.
Table 3. The distribution of the projects submitted to TUBITAK regional science committees by municipality and school type (as well as the official distribution of the school types)
School Types
Cities
Afyonkarahisar
f(%)Balikesir f(%)
Bilecik f(%)
Bursa f(%)
Canakkale f(%)
Eskisehir f(%)
Kutahya f(%)
Yalova f(%)
Total f(%)
Official Data
%Public Schools 73 – 68.2%
Vocational Schools
Vocational High Schools
0
1
(0.9)0
1
(0.9)0
1
(0.9)0
0
3
(2.8)1.58
Anatolian Technical High Schools, Vocational High Schools, Industrial Vocational High Schools
0
1
(0.9)0
1
(0.9)0
0
0
0
2
(1.9)10.9
Anatolian Medical Vocational High Schools and Medical Vocational High Schools
0
1
(0.9)0
0
0
0
0
0
1
(0.9)5.6
Anatolian Imam Hatip (Religious) High Schools and Imam Hatip (Religious) High Schools
0
0
0
1
(0.9)0
0
0
0
1
(0.9)9
Military High Schools
0
0
0
4
(3.7)0
0
0
0
4
(3.7)0.12
Police Schools
0
0
0
5
(4.7)0
0
0
0
5
(4.7)0.12
Other
0
0
0
0
0
0
0
0
-
16.7
Regular High Schools
1
(0.9)0
0
4
(3.7)1
(0.9)0
0
0
6
(5.6)20.6
Multi-Program High Schools
0
0
0
1
(0.9)0
0
0
0
1
(0.9)6.69
Anatolian High Schools
4
(3.7)3
(2.8)1
(0.9)14
0
11
(10.3)0
0
33
(30.8)18.37
Science High Schools
0
1
(0.9)2
(1.9)0
0
10
(9.3)4
(3.7)0
17
(15.9)2.67
Social Sciences High Schools
0
0
0
0
0
0
0
0
-
0.73
Private 34 - 31.8%
Anatolian High Schools
0
1
(0.9)0
9
(8.4)0
0
2
(1.9)0
12
(11.2)0.97
Science High Schools
1
(0.9)0
0
9
(8.4)0
0
0
0
10
(9.3)1.45
Private High Schools
4
(3.7)1
(0.9)0
2
(1.9)0
0
5
(4.7)0
12
(11.2)4.5
Total
10
(9.3)9
(8.4)3
(2.8)51
(47.7)1
(0.9)22
(20.6)11
(10.3)0
107 (100)
100
The distribution of the submitted projects by year and school type is given in Table 4. According to the table, the greatest number of Biology projects came from Anatolian High Schools (30.8%) and Science High Schools (15.9%). Private schools are at 31.7%. It is remarkable that regular high schools have significantly low application numbers (5.6%). According to the Table 3, the biggest number of applications was in 2012 in which 36 (33.6%) projects were submitted, and the fewest number of applications was in 2010 in which just 19 (17.8%) projects were submitted. On the other hand, it is understood that the highest number of applications came from Private Schools in 2012 (31.7%), from Public Schools in 2011 (21.2%), from Science High Schools in 2009 (6.5%), and from Anatolian High Schools in 2011 (14%). Based on the numbers, it is understood that there is a disorder in applications. As can be seen from Table 4, it is remarkable that the number of applications from science high schools have been dropping every year, whereas this number is on the rise for regular high schools.
In Turkey, educational activities are mostly university entrance exam oriented in science high schools which admit students with high scores. Out-of-school activities such as project competitions are considered just a loss of time and an obstacle to preparation for university entrance exam by science high students and their parents. These kinds of activities are subjected to alternative assessment and evaluation by teachers working in regular high schools, which include students with a relatively lower achievement, so that they contribute to educational process. Teachers in these schools give a performance grade to their students based on such activities. In addition, with an agreement between the Ministry of National Education and TUBITAK, a decision has been made to give fee to project advisors; and the Ministry of National Education has called teachers and students to join project competitions, which may be the reason why the number of project applications from public schools has increased (Table 4).
Table 4. The distribution of the submitted projects by year and school type
School Types
2009
2010
2011
2012
Total f(%)
Public Schools
Vocational Schools
Vocational High Schools
1
(0.9)0
1
(0.9)1
(0.9)3
(2.8)Anatolian Technical High Schools, Vocational High Schools, and Industrial Vocational High Schools
2
(1.9)0
0
0
2
(1.9)Anatolian Medical Vocational High Schools, and Medical Vocational High Schools
0
0
0
1
(0.9)1
(0.9)Anatolian Imam Hatip (Religious) High Schools, and Imam Hatip (Religious) High Schools
1
(0.9)0
0
0
1
(0.9)Military High Schools
1
(0.9)1
(0.9)1
(0.9)1
(0.9)4
(3.7)Police Schools
0
0
1
(0.9)4
(3.7)5
(4.7)Other
0
0
0
0
0
Regular High Schools
0
1
(0.9)1
(0.9)4
(3.7)6
(5.6)Multi-Program High Schools
0
0
1
(0.9)0
1
(0.9)Anatolian High Schools
2
(1.9)8
(7.5)15
(14)8
(7.5)33
(30.8)Science High Schools
7
(6.5)5
(4.7)3
(2.8)2
(1.9)17
(15.9)Social Sciences High Schools
0
0
0
0
0
Private Schools
Anatolian High Schools
0
0
3
(2.8)9
(8.4)12
(11.2)Science High Schools
3
(2.8)2
(1.9)1
(0.9)4
(3.7)10
(9.3)Private High Schools
8
(7.5)2
(1.9)0
2
(1.9)12
(11.2)Total
25 (23.4)
19 (17.8)
27 (25.2)
36 (33.6)
107 (100)
Based on the distribution by provinces, it is seen that the biggest number of applications came from the following provinces: Bursa (47.7%), Eskişehir (20.5%), Kütahya (10.3%), Afyonkarahisar (9.4%), Balıkesir (8.4%), Bilecik (%2.8), Yalova (0%), and Çanakkale (0.9%).
Based on the gender distribution of the students designing projects, it is seen that 21 (%11.23) females/23 (%12.3) males designed projects in 2009; 21 (%11.23) females/9 (%4.81) males designed projects in 2010; 23 (%12.3) females/23 (%12.3) males designed projects in 2011; 28 (%14.97) females/39 (%20.86) males designed projects in 2012. When we inspect the gender distribution of all projects between 2009 and 2012, it is seen that 94 of them are from boys (50.27%) whereas 93 (49.73+) are from girls.
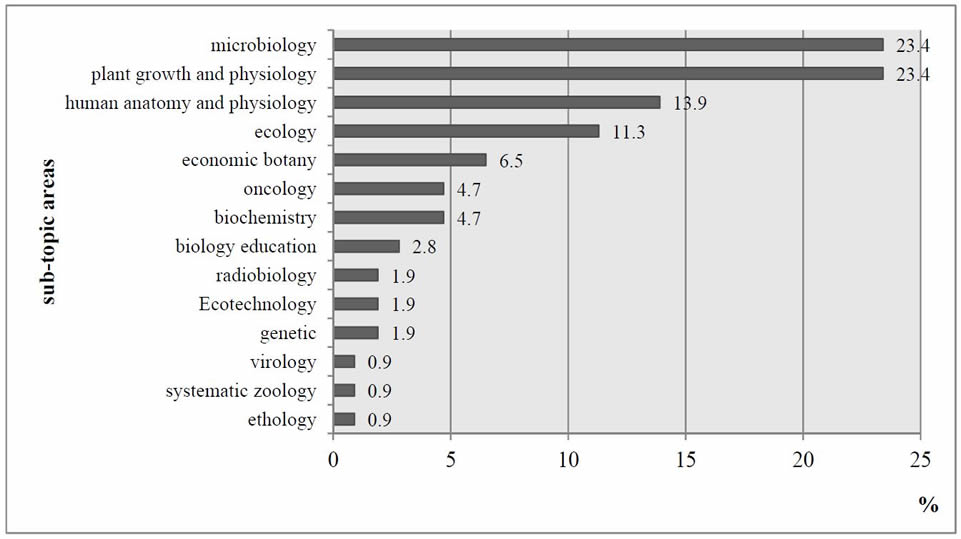
It is understood that there were more projects about Microbiology (23.4%), Plant Development and Physiology (23.4%), Human Anatomy and Physiology (13.9%), Ecology (11.3%), and Economic Botany (%6.5) in comparison to other sub-subject areas (Figure 1).
Figure 1. The distribution of biology projects by sub-subject areas
The Table 5 presents the findings obtained from the Secondary Education Project Evaluation Chart. The results were interpreted by taking the average of two different expert evaluators.
According to the Table 5, the subject and problem were clearly determined in 50.5% of 107 projects, and partly determined in 34.5%. 38.8% of students provided a partial clear definition of the problem intended to be solved through project. However, 35.0% of students failed to provide any clear definition. It was seen that sub-problems were not determined in 67.8% of the projects.
It was found that 53.3% of the projects did not have original subjects, and 85% did not have a creative nature.
Table 5. The secondary education project evaluation chart
Criteria
2009-2012
YES
(%)PARTLY
(%)NO
(%)TOTAL (%)
a) The Determination of Problem
1) Problem was determined.
50.5
34.5
15.0
100
2) Problem was clearly defined.
26.2
38.8
35.0
100
3) Sub-problems were determined.
8.8
23.4
67.8
100
b) Originality and Creativity
1) Subject is original.
10.3
36.4
53.3
100
2) A method different from the previous ones is used for
dealing with the subject.2.8
12.2
85.0
100
c) Scientific Method
1) Hypothesis was established.
32.7
25.7
41.6
100
2) A plan was developed for the method to be followed.
33.2
48.1
18.7
100
3) Method contained necessary variables for testing the
hypothesis.25.7
33.6
40.7
100
4) Experimental processes were carried out.
36.5
32.7
30.8
100
5) Sufficient data were collected.
19.2
36.9
43.9
100
6) Data analysis was properly performed.
15.8
43.5
40.7
100
d) Consistency and Contribution
1) There is a consistency between purpose and result.
42.5
37.4
20.1
100
2) There is a consistency between problem and sub-problems.
20.6
35.0
44.4
100
3) Provides a new approach to impart a new method or field.
4.7
11.7
83.6
100
e) Usefulness
1) It can be used for different scientific and technical fields.
9.3
29.9
60.8
100
2) An added value can be introduced to economy.
9.3
33.2
57.5
100
3) Benefits can be provided to society.
9.8
42.5
47.7
100
f) Implementability
1) It can be used to solve other problems related to the field
results have been presented.4.2
55.1
40.7
100
g) Literature Review
1) Necessary sources were reached.
22.0
53.3
24.7
100
2) Sources were used in the Project Report.
20.6
35.5
43.9
100
3) Sources were associated with the project subject.
10.8
18.7
70.5
100
h) Result
1) The project was finalized.
52.8
35.5
11.7
100
2) Data were correctly interpreted.
15.0
46.8
38.2
100
When we examine the scientific method used for solving the problems detected in the projects it was determined that no hypothesis was established in 41.6% of the projects, 33.2% of the projects had a plan concerning the method to be followed for reaching a solution, 18.7% did not develop any plan concerning the method to be followed for reaching a solution, and 40.7% had methods not containing the variables required for testing the project hypothesis. It was concluded that 36.5% of students performed the experimental processes as required by projects, but 30.8% did not perform such processes. 43.9% of students failed to collect sufficient data at the end of these processes. The proper analysis of the collected data was partly conducted by 15.8% of students. 40.7% of students failed to conduct a proper analysis of the collected data.
Based on the examination of the consistency between purposes and solutions, it is seen that there was just a consistency between purpose and solution in 42.5% of the projects. 44.4% of the projects failed to ensure a consistency between problems and sub-problems. 83.8% of the projects did not introduce any new method to literature, and 11.7% partly achieved it. Based on the examination of the usage of the projects in different scientific and technical fields and usefulness for economy and society, it is seen that 60.8% of the projects did not have any feature to be used in different scientific and technical fields, 57.5% would not create any added value for economy if they were implemented, 9.3% would provide a partial added value for economy if they were implemented, and 47.7% did not provide any benefit to society. It was seen that 4.2% of the projects put forward solutions that could be used for solving the problems about related fields.
Based on the examination of the projects in terms of literature review and report writing, it is seen that 22.0% of the projects reached necessary scientific sources, 53.3% partly reaches such sources, and 43.9% did not use such sources in the project report. The percentage of those who were unable to associate the attained sources with the project topic was 70.5%. 52.8% of the projects were finalized. In 15% of the projects, obtained data could be interpreted by establishing a cause and effect relationship.
Kruskal-Wallis test was carried out for determining whether there was any year-dependent significant difference between the results introduced by 8 criteria included in the Secondary Education Project Evaluation Chart (Table 6). This test is a non-parametric alternative of the inter-group one way analysis of variance. This analysis allows making a comparison of three or more groups that have continuous variables.
Because the level of significance in the three criteria (utility, applicability, and source scanning) were lower than 0.05, it may be said that these three criteria displayed significant difference over years (Table 6). The group medians for the following criteria show a similar distribution over years: the determination of the problem, creativity and originality, the scientific method used, results, consistency, and contribution.
Table 6. The results of analysis of the criteria included in the evaluation chart for biology projects event for secondary school students by years
Criteria
df
The Value of
Kruskal-Wallisp
a) The determination of problem
3
5.142
0.162
b) Originality and creativity
3
2.425
0.489
c) Scientific method
3
0.955
0.812
d) Consistency and contribution
3
4.178
0.243
e) Usefulness
3
28.959
0.000*
f) Implementability
3
13.597
0.004*
g) Literature review
3
12.508
0.006*
h) Result
3
0.463
0.927
*p<0.05
The year-dependent means of the criteria included in the chart were calculated. The related results are given in the Table 7. Based on the mean ranks, it is seen that Scientific Method was more successful in 2009, Literature Review was more successful in 2010, Usefulness was more successful in 2011, Literature Review was more successful in 2012; but Usefulness failed in 2009 and 2010, Literature Review failed in 2011, Scientific Method failed in 2012.
Table 7. The mean ranks of the criteria included in the evaluation chart for biology projects event for secondary school students by years
Year
N
Criteria
The Mean Ranks
2009
25
53.76
c53.1
h51.12
d48.06
g48.04
b43
a38.64
f35.92
e2010
19
66.55
g57.92
h57.39
c54.92
b54.45
f51.13
a48.34
d36.21
e2011
27
74.43
e68.48
f64.31
d60.3
b59.02
a56.76
c51.98
h39.69
g2012
36
62.24
g60.63
e59.39
a54.07
h53.57
f52.93
b51.25
d50.31
cIn addition, when we examine these projects in terms of their mean rank, it is seen that they have been: successful in the following criteria: Scientific Method in 2009, Literature Review in 2010, Usefulness in 2011, Literature Review in 2012, unsuccessful in the following criteria: Usefulness in 2009 and 2010, Literature Review in 2011, Scientific Method in 2012 (Table 7).